Allstate 2011 Annual Report Download - page 156
Download and view the complete annual report
Please find page 156 of the 2011 Allstate annual report below. You can navigate through the pages in the report by either clicking on the pages listed below, or by using the keyword search tool below to find specific information within the annual report.-
 1
1 -
2
-
3
-
4
-
5
-
6
-
7
-
8
-
9
-
10
-
11
-
12
-
13
-
14
-
15
-
16
-
17
-
18
-
19
-
20
-
21
-
22
-
23
-
24
-
25
-
26
-
27
-
28
-
29
-
30
-
31
-
32
-
33
-
34
-
35
-
36
-
37
-
38
-
39
-
40
-
41
-
42
-
43
-
44
-
45
-
46
-
47
-
48
-
49
-
50
-
51
-
52
-
53
-
54
-
55
-
56
-
57
-
58
-
59
-
60
-
61
-
62
-
63
-
64
-
65
-
66
-
67
-
68
-
69
-
70
-
71
-
72
-
73
-
74
-
75
-
76
-
77
-
78
-
79
-
80
-
81
-
82
-
83
-
84
-
85
-
86
-
87
-
88
-
89
-
90
-
91
-
92
-
93
-
94
-
95
-
96
-
97
-
98
-
99
-
100
-
101
-
102
-
103
-
104
-
105
-
106
-
107
-
108
-
109
-
110
-
111
-
112
-
113
-
114
-
115
-
116
-
117
-
118
-
119
-
120
-
121
-
122
-
123
-
124
-
125
-
126
-
127
-
128
-
129
-
130
-
131
-
132
-
133
-
134
-
135
-
136
-
137
-
138
-
139
-
140
-
141
-
142
-
143
-
144
-
145
-
 146
146 -
 147
147 -
 148
148 -
 149
149 -
 150
150 -
 151
151 -
 152
152 -
 153
153 -
 154
154 -
 155
155 -
 156
156 -
 157
157 -
 158
158 -
 159
159 -
 160
160 -
 161
161 -
 162
162 -
 163
163 -
 164
164 -
 165
165 -
 166
166 -
167
-
168
-
169
-
170
-
171
-
172
-
173
-
174
-
175
-
176
-
177
-
178
-
179
-
180
-
181
-
182
-
183
-
184
-
185
-
186
-
187
-
188
-
189
-
190
-
191
-
192
-
193
-
194
-
195
-
196
-
197
-
198
-
199
-
200
-
201
-
202
-
203
-
204
-
205
-
206
-
207
-
208
-
209
-
210
-
211
-
212
-
213
-
214
-
215
-
216
-
217
-
218
-
219
-
220
-
221
-
222
-
223
-
224
-
225
-
226
-
227
-
228
-
229
-
230
-
231
-
232
-
233
-
234
-
235
-
236
-
237
-
238
-
239
-
240
-
241
-
242
-
243
-
244
-
245
-
246
-
247
-
248
-
249
-
250
-
251
-
252
-
253
-
254
-
255
-
256
-
257
-
258
-
259
-
260
-
261
-
262
-
263
-
264
-
265
-
266
-
267
-
268
-
269
-
270
-
271
-
272
-
273
-
274
-
275
-
276
 |
 |

not limited to, historical collateral performance, collateral type, transaction vintage year, geographic concentrations,
borrower credit quality, origination practices of the transaction sponsor, and practices of the mortgage loan servicers.
Current loan-to-value ratios of underlying collateral are not consistently available and accordingly they are not a primary
factor in our impairment evaluation. While our projections are developed internally and customized to our specific
holdings, they are informed by and benchmarked against credit opinions obtained from third parties, such as industry
analysts, nationally recognized credit rating agencies and an RMBS loss modeling advisory service. The default rate and
loss severity forecasts result in an estimate of trust-level projected additional collateral loss.
We then analyze the actual cumulative collateral losses incurred to date by the securitization trust, our projected
additional collateral losses expected to be incurred and the position of the class of securities we own in the
securitization trust relative to the trust’s other classes to determine whether any of the collateral losses will be applied to
our class. If our class has remaining credit enhancement sufficient to withstand the projected additional collateral
losses, no collateral losses will be realized by our class and we expect to collect all contractual principal and interest of
the security we own. Remaining credit enhancement is measured in terms of (i) subordination from other classes of
securities in the trust that are contractually obligated to absorb losses before the class of security we own and (ii) the
expected impact of other structural features embedded in the securitization trust beneficial to our class, such as
overcollateralization and excess spread.
For securities where there is insufficient remaining credit enhancement for the class of securities we own, a
recovery value is calculated based on our best estimate of future cash flows specific to that security. This estimate is
based on the contractual principal payments and current interest payments of the securities we own, adjusted for actual
cumulative collateral losses incurred to date and the projected additional collateral losses expected to be incurred. This
estimate also takes into consideration additional secondary sources of credit support, such as reliable bond insurance.
For securities without secondary sources of credit support or for which the secondary sources do not fully offset the
actual and projected additional collateral losses applied to them, a credit loss is recorded in earnings to the extent
amortized cost exceeds recovery value.
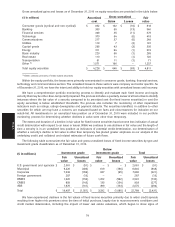
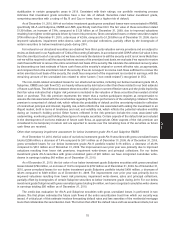
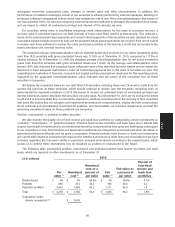
98.8% and 1.2% of the fair value of our below investment grade Alt-A securities with gross unrealized losses were
issued with Aaa and Aa original ratings and capital structure classifications, respectively. 87.4%, 10.7% and 1.9% of the
fair value of our below investment grade Subprime securities with gross unrealized losses were issued with Aaa, Aa and
A original ratings and capital structure classifications, respectively. As described previously, Alt-A and Subprime
securities with higher original ratings typically have priority in receiving the principal repayments on the underlying
collateral compared to those with lower original ratings. While the projected cash flow assumptions for our below
investment grade Alt-A and Subprime securities with gross unrealized losses have deteriorated since the securities
were originated, as reflected by their current credit ratings, these securities continue to retain the payment priority
features that existed at the origination of the securitization trust.
76
MD&A