Allstate 2011 Annual Report Download - page 215
Download and view the complete annual report
Please find page 215 of the 2011 Allstate annual report below. You can navigate through the pages in the report by either clicking on the pages listed below, or by using the keyword search tool below to find specific information within the annual report.-
 1
1 -
2
-
3
-
4
-
5
-
6
-
7
-
8
-
9
-
10
-
11
-
12
-
13
-
14
-
15
-
16
-
17
-
18
-
19
-
20
-
21
-
22
-
23
-
24
-
25
-
26
-
27
-
28
-
29
-
30
-
31
-
32
-
33
-
34
-
35
-
36
-
37
-
38
-
39
-
40
-
41
-
42
-
43
-
44
-
45
-
46
-
47
-
48
-
49
-
50
-
51
-
52
-
53
-
54
-
55
-
56
-
57
-
58
-
59
-
60
-
61
-
62
-
63
-
64
-
65
-
66
-
67
-
68
-
69
-
70
-
71
-
72
-
73
-
74
-
75
-
76
-
77
-
78
-
79
-
80
-
81
-
82
-
83
-
84
-
85
-
86
-
87
-
88
-
89
-
90
-
91
-
92
-
93
-
94
-
95
-
96
-
97
-
98
-
99
-
100
-
101
-
102
-
103
-
104
-
105
-
106
-
107
-
108
-
109
-
110
-
111
-
112
-
113
-
114
-
115
-
116
-
117
-
118
-
119
-
120
-
121
-
122
-
123
-
124
-
125
-
126
-
127
-
128
-
129
-
130
-
131
-
132
-
133
-
134
-
135
-
136
-
137
-
138
-
139
-
140
-
141
-
142
-
143
-
144
-
145
-
146
-
147
-
148
-
149
-
150
-
151
-
152
-
153
-
154
-
155
-
156
-
157
-
158
-
159
-
160
-
161
-
162
-
163
-
164
-
165
-
166
-
167
-
168
-
169
-
170
-
171
-
172
-
173
-
174
-
175
-
176
-
177
-
178
-
179
-
180
-
181
-
182
-
183
-
184
-
185
-
186
-
187
-
188
-
189
-
190
-
191
-
192
-
193
-
194
-
195
-
196
-
197
-
198
-
199
-
200
-
201
-
202
-
203
-
204
-
 205
205 -
 206
206 -
 207
207 -
 208
208 -
 209
209 -
 210
210 -
 211
211 -
 212
212 -
 213
213 -
 214
214 -
 215
215 -
 216
216 -
 217
217 -
 218
218 -
 219
219 -
 220
220 -
 221
221 -
 222
222 -
 223
223 -
 224
224 -
 225
225 -
226
-
227
-
228
-
229
-
230
-
231
-
232
-
233
-
234
-
235
-
236
-
237
-
238
-
239
-
240
-
241
-
242
-
243
-
244
-
245
-
246
-
247
-
248
-
249
-
250
-
251
-
252
-
253
-
254
-
255
-
256
-
257
-
258
-
259
-
260
-
261
-
262
-
263
-
264
-
265
-
266
-
267
-
268
-
269
-
270
-
271
-
272
-
273
-
274
-
275
-
276
 |
 |

whether a significant decrease in the volume and level of activity for a specific asset has occurred include the level of
new issuances in the primary market, trading volume in the secondary market, the level of credit spreads over historical
levels, applicable bid-ask spreads, and price consensus among market participants and other pricing sources.
The second situation where the Company classifies securities in Level 3 is where specific inputs significant to the
fair value estimation models are not market observable. This occurs in two primary instances. The first relates to the
Company’s use of broker quotes. The second relates to auction rate securities (‘‘ARS’’) backed by student loans for
which a key input, the anticipated date liquidity will return to this market, is not market observable.
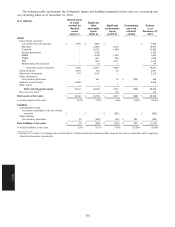
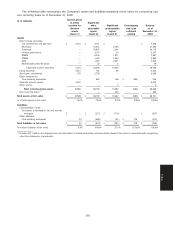
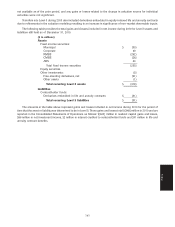
Certain assets are not carried at fair value on a recurring basis, including investments such as mortgage loans,
limited partnership interests, bank loans and policy loans. Accordingly, such investments are only included in the fair
value hierarchy disclosure when the investment is subject to remeasurement at fair value after initial recognition and the
resulting remeasurement is reflected in the consolidated financial statements. In addition, derivatives embedded in
fixed income securities are not disclosed in the hierarchy as free-standing derivatives since they are presented with the
host contracts in fixed income securities. As of December 31, 2010, 74.1% of total assets are measured at fair value and
0.9% of total liabilities are measured at fair value.
In determining fair value, the Company principally uses the market approach which generally utilizes market
transaction data for the same or similar instruments. To a lesser extent, the Company uses the income approach which
involves determining fair values from discounted cash flow methodologies. For the majority of Level 2 and Level 3
valuations, a combination of the market and income approaches is used.
Summary of significant valuation techniques for assets and liabilities measured at fair value on a recurring basis
Level 1 measurements
• Fixed income securities: Comprise U.S. Treasuries. Valuation is based on unadjusted quoted prices for
identical assets in active markets that the Company can access.
• Equity securities: Comprise actively traded, exchange-listed U.S. and international equity securities. Valuation
is based on unadjusted quoted prices for identical assets in active markets that the Company can access.
• Short-term: Comprise actively traded money market funds that have daily quoted net asset values for identical
assets that the Company can access.
• Separate account assets: Comprise actively traded mutual funds that have daily quoted net asset values for
identical assets that the Company can access. Net asset values for the actively traded mutual funds in which
the separate account assets are invested are obtained daily from the fund managers.
Level 2 measurements
• Fixed income securities:
U.S. government and agencies: The primary inputs to the valuation include quoted prices for identical or similar
assets in markets that are not active, contractual cash flows, benchmark yields and credit spreads.
Municipal: The primary inputs to the valuation include quoted prices for identical or similar assets in markets
that are not active, contractual cash flows, benchmark yields and credit spreads.
Corporate, including privately placed: The primary inputs to the valuation include quoted prices for identical or
similar assets in markets that are not active, contractual cash flows, benchmark yields and credit spreads. Also
included are privately placed securities valued using a discounted cash flow model that is widely accepted in
the financial services industry and uses market observable inputs and inputs derived principally from, or
corroborated by, observable market data. The primary inputs to the discounted cash flow model include an
interest rate yield curve, as well as published credit spreads for similar assets in markets that are not active that
incorporate the credit quality and industry sector of the issuer.
Foreign government: The primary inputs to the valuation include quoted prices for identical or similar assets in
markets that are not active, contractual cash flows, benchmark yields and credit spreads.
RMBS – U.S. government sponsored entities (‘‘U.S. Agency’’), Prime residential mortgage-backed securities
(‘‘Prime’’) and Alt-A residential mortgage-backed securities (‘‘Alt-A’’); ABS – auto and student loans and
other: The primary inputs to the valuation include quoted prices for identical or similar assets in markets that
are not active, contractual cash flows, benchmark yields, prepayment speeds, collateral performance and credit
spreads.
135
Notes