Allstate 2011 Annual Report Download - page 114
Download and view the complete annual report
Please find page 114 of the 2011 Allstate annual report below. You can navigate through the pages in the report by either clicking on the pages listed below, or by using the keyword search tool below to find specific information within the annual report.-
 1
1 -
2
-
3
-
4
-
5
-
6
-
7
-
8
-
9
-
10
-
11
-
12
-
13
-
14
-
15
-
16
-
17
-
18
-
19
-
20
-
21
-
22
-
23
-
24
-
25
-
26
-
27
-
28
-
29
-
30
-
31
-
32
-
33
-
34
-
35
-
36
-
37
-
38
-
39
-
40
-
41
-
42
-
43
-
44
-
45
-
46
-
47
-
48
-
49
-
50
-
51
-
52
-
53
-
54
-
55
-
56
-
57
-
58
-
59
-
60
-
61
-
62
-
63
-
64
-
65
-
66
-
67
-
68
-
69
-
70
-
71
-
72
-
73
-
74
-
75
-
76
-
77
-
78
-
79
-
80
-
81
-
82
-
83
-
84
-
85
-
86
-
87
-
88
-
89
-
90
-
91
-
92
-
93
-
94
-
95
-
96
-
97
-
98
-
99
-
100
-
101
-
102
-
103
-
 104
104 -
 105
105 -
 106
106 -
 107
107 -
 108
108 -
 109
109 -
 110
110 -
 111
111 -
 112
112 -
 113
113 -
 114
114 -
 115
115 -
 116
116 -
 117
117 -
 118
118 -
 119
119 -
 120
120 -
 121
121 -
 122
122 -
 123
123 -
 124
124 -
125
-
126
-
127
-
128
-
129
-
130
-
131
-
132
-
133
-
134
-
135
-
136
-
137
-
138
-
139
-
140
-
141
-
142
-
143
-
144
-
145
-
146
-
147
-
148
-
149
-
150
-
151
-
152
-
153
-
154
-
155
-
156
-
157
-
158
-
159
-
160
-
161
-
162
-
163
-
164
-
165
-
166
-
167
-
168
-
169
-
170
-
171
-
172
-
173
-
174
-
175
-
176
-
177
-
178
-
179
-
180
-
181
-
182
-
183
-
184
-
185
-
186
-
187
-
188
-
189
-
190
-
191
-
192
-
193
-
194
-
195
-
196
-
197
-
198
-
199
-
200
-
201
-
202
-
203
-
204
-
205
-
206
-
207
-
208
-
209
-
210
-
211
-
212
-
213
-
214
-
215
-
216
-
217
-
218
-
219
-
220
-
221
-
222
-
223
-
224
-
225
-
226
-
227
-
228
-
229
-
230
-
231
-
232
-
233
-
234
-
235
-
236
-
237
-
238
-
239
-
240
-
241
-
242
-
243
-
244
-
245
-
246
-
247
-
248
-
249
-
250
-
251
-
252
-
253
-
254
-
255
-
256
-
257
-
258
-
259
-
260
-
261
-
262
-
263
-
264
-
265
-
266
-
267
-
268
-
269
-
270
-
271
-
272
-
273
-
274
-
275
-
276
 |
 |

These actions have allowed Encompass to position itself with aligned agencies as the package policy carrier of
choice for customers with broad personal lines coverage needs in order to drive stable, consistent earnings growth over
time.
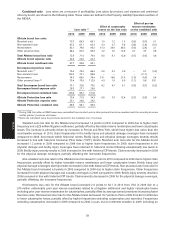
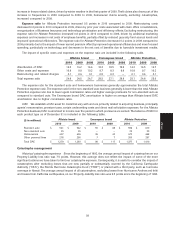
Rate changes that are indicated based on loss trend analysis to achieve a targeted return will continue to be
pursued. The following table shows the rate changes that were approved for standard auto and does not include rating
plan enhancements, including the introduction of discounts and surcharges, that result in no change in the overall rate
level in the state. These rate changes do not reflect initial rates filed for insurance subsidiaries initially writing business
in a state.
# of States Countrywide (%) (1) State Specific (%) (2)(3)
2010 2009 2010 2009 2010 2009
Allstate brand (4) 45 (5) 36 1.4 4.6 2.2 7.2
Encompass brand 24 36 1.4 7.3 2.7 9.3
(1) Represents the impact in the states where rate changes were approved during 2010 and 2009, respectively, as a percentage of total
countrywide prior year-end premiums written.
(2) Represents the impact in the states where rate changes were approved during 2010 and 2009, respectively, as a percentage of its
respective total prior year-end premiums written in those states.
(3) Based on historical premiums written in those states, rate changes approved for standard auto totaled $218 million in 2010
compared to $784 million in 2009.
(4) Includes Washington D.C.
(5) Includes targeted rate decreases in certain markets to improve our competitive position for target customers.
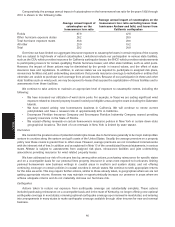
Non-standard auto premiums written totaled $889 million in 2010, a decrease of 6.3% from $949 million in 2009,
following a 10.3% decrease in 2009 from $1.06 billion in 2008.
Allstate brand Encompass brand
Non-Standard Auto 2010 2009 2008 2010 2009 2008
PIF (thousands) 640 719 745 5 20 39
Average premium-gross written
(6 months) $ 624 $ 616 $ 624 $ 426 $ 476 $ 479
Renewal ratio (%) (6 months) 71.4 72.5 73.7 46.9 67.1 68.3
Allstate brand non-standard auto premiums written totaled $883 million in 2010, a decrease of 4.7% from
$927 million in 2009, following a 8.9% decrease in 2009 from $1.02 billion in 2008. Contributing to the Allstate brand
non-standard auto premiums written decrease in 2010 compared to 2009 were the following:
– decrease in PIF as of December 31, 2010 compared to December 31, 2009, due to a decline in the number of
policies available to renew and fewer new issued applications
– 14.9% decrease in new issued applications to 309 thousand in 2010 from 363 thousand in 2009
– increase in average gross premium in 2010 compared to 2009
– 1.1 point decrease in the renewal ratio in 2010 compared to 2009
Allstate brand non-standard auto premiums written decreased in 2009 compared to 2008. Contributing to the
Allstate brand non-standard auto premiums written decrease in 2009 compared to 2008 were the following:
– decrease in PIF as of December 31, 2009 compared to December 31, 2008, due to new business production that
was insufficient to offset declines in the renewal ratio and polices available to renew
– 10.7% increase in new issued applications to 363 thousand in 2009 from 328 thousand in 2008
– decrease in average gross premium in 2009 compared to 2008
– decrease in the renewal ratio in 2009 compared to 2008
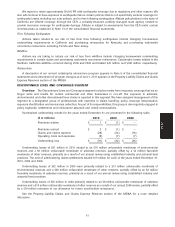
Rate changes that are indicated based on loss trend analysis to achieve a targeted return will continue to be
pursued. The following table shows the rate changes that were approved for non-standard auto and does not include
rating plan enhancements, including the introduction of discounts and surcharges, that result in no change in the
34
MD&A