Allstate 2011 Annual Report Download - page 155
Download and view the complete annual report
Please find page 155 of the 2011 Allstate annual report below. You can navigate through the pages in the report by either clicking on the pages listed below, or by using the keyword search tool below to find specific information within the annual report.-
 1
1 -
2
-
3
-
4
-
5
-
6
-
7
-
8
-
9
-
10
-
11
-
12
-
13
-
14
-
15
-
16
-
17
-
18
-
19
-
20
-
21
-
22
-
23
-
24
-
25
-
26
-
27
-
28
-
29
-
30
-
31
-
32
-
33
-
34
-
35
-
36
-
37
-
38
-
39
-
40
-
41
-
42
-
43
-
44
-
45
-
46
-
47
-
48
-
49
-
50
-
51
-
52
-
53
-
54
-
55
-
56
-
57
-
58
-
59
-
60
-
61
-
62
-
63
-
64
-
65
-
66
-
67
-
68
-
69
-
70
-
71
-
72
-
73
-
74
-
75
-
76
-
77
-
78
-
79
-
80
-
81
-
82
-
83
-
84
-
85
-
86
-
87
-
88
-
89
-
90
-
91
-
92
-
93
-
94
-
95
-
96
-
97
-
98
-
99
-
100
-
101
-
102
-
103
-
104
-
105
-
106
-
107
-
108
-
109
-
110
-
111
-
112
-
113
-
114
-
115
-
116
-
117
-
118
-
119
-
120
-
121
-
122
-
123
-
124
-
125
-
126
-
127
-
128
-
129
-
130
-
131
-
132
-
133
-
134
-
135
-
136
-
137
-
138
-
139
-
140
-
141
-
142
-
143
-
144
-
 145
145 -
 146
146 -
 147
147 -
 148
148 -
 149
149 -
 150
150 -
 151
151 -
 152
152 -
 153
153 -
 154
154 -
 155
155 -
 156
156 -
 157
157 -
 158
158 -
 159
159 -
 160
160 -
 161
161 -
 162
162 -
 163
163 -
 164
164 -
 165
165 -
166
-
167
-
168
-
169
-
170
-
171
-
172
-
173
-
174
-
175
-
176
-
177
-
178
-
179
-
180
-
181
-
182
-
183
-
184
-
185
-
186
-
187
-
188
-
189
-
190
-
191
-
192
-
193
-
194
-
195
-
196
-
197
-
198
-
199
-
200
-
201
-
202
-
203
-
204
-
205
-
206
-
207
-
208
-
209
-
210
-
211
-
212
-
213
-
214
-
215
-
216
-
217
-
218
-
219
-
220
-
221
-
222
-
223
-
224
-
225
-
226
-
227
-
228
-
229
-
230
-
231
-
232
-
233
-
234
-
235
-
236
-
237
-
238
-
239
-
240
-
241
-
242
-
243
-
244
-
245
-
246
-
247
-
248
-
249
-
250
-
251
-
252
-
253
-
254
-
255
-
256
-
257
-
258
-
259
-
260
-
261
-
262
-
263
-
264
-
265
-
266
-
267
-
268
-
269
-
270
-
271
-
272
-
273
-
274
-
275
-
276
 |
 |

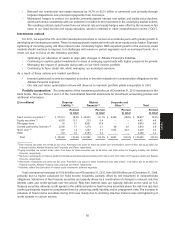
stabilization in certain geographic areas in 2010. Consistent with their ratings, our portfolio monitoring process
indicates that investment grade securities have a low risk of default. Securities rated below investment grade,
comprising securities with a rating of Ba, B and Caa or lower, have a higher risk of default.
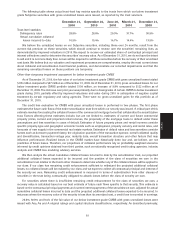
As of December 31, 2010, 68% of our below investment grade gross unrealized losses were concentrated in RMBS,
specifically Alt-A and Subprime, CMBS and ABS, specifically cash flow CLO. The fair value of these securities totaled
$1.39 billion, an increase of 7.8%, compared to $1.29 billion as of December 31, 2009, due to improved valuations
resulting from tighter credit spreads driven by lower risk premiums. Gross unrealized losses on these securities totaled
$736 million as of December 31, 2010, a decrease of 42.6%, compared to $1.28 billion as of December 31, 2009, due to
improved valuations, impairment write-downs, sales and principal collections, partially offset by the downgrade of
certain securities to below investment grade during 2010.
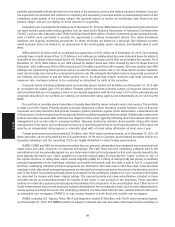
Fair values for our structured securities are obtained from third-party valuation service providers and are subject to
review as disclosed in our Application of Critical Accounting Estimates. In accordance with GAAP, when fair value is less
than the amortized cost of a security and we have not made the decision to sell the security and it is not more likely than
not we will be required to sell the security before recovery of its amortized cost basis, we evaluate if we expect to receive
cash flows sufficient to recover the entire amortized cost basis of the security. We calculate the estimated recovery value
by discounting our best estimate of future cash flows at the security’s original or current effective rate, as appropriate,
and compare this to the amortized cost of the security. If we do not expect to receive cash flows sufficient to recover the
entire amortized cost basis of the security, the credit loss component of the impairment is recorded in earnings, with the
remaining amount of the unrealized loss related to other factors (‘‘non-credit-related’’) recognized in OCI.
The non-credit-related unrealized losses for our structured securities, including our below investment grade Alt-A,
Subprime, CMBS and cash flow CLO, are heavily influenced by risk factors other than those related to our best estimate
of future cash flows. The difference between these securities’ original or current effective rates and the yields implied by
their fair value indicates that a higher risk premium is included in the valuation of these securities than existed at initial
issue or purchase. This risk premium represents the return that a market participant requires as compensation to
assume the risk associated with the uncertainties regarding the future performance of the underlying collateral. The risk
premium is comprised of: default risk, which reflects the probability of default and the uncertainty related to collection
of contractual principal and interest; liquidity risk, which reflects the risk associated with exiting the investment in an
illiquid market, both in terms of timeliness and cost; and volatility risk, which reflects the potential valuation volatility
during an investor’s holding period. Other factors reflected in the risk premium include the costs associated with
underwriting, monitoring and holding these types of complex securities. Certain aspects of the default risk are included
in the development of our best estimate of future cash flows, as appropriate. Other aspects of the risk premium are
considered to be temporary in nature and are expected to reverse over the remaining lives of the securities as future
cash flows are received.
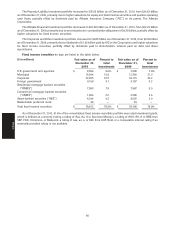
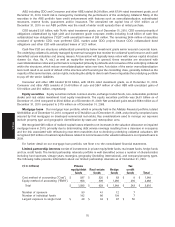
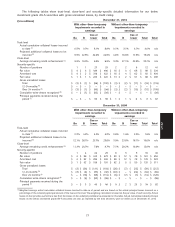
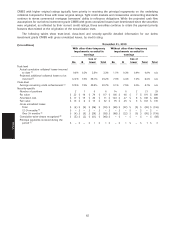
Other-than-temporary impairment assessment for below investment grade Alt-A and Subprime RMBS
As of December 31, 2010, the fair value of our below investment grade Alt-A securities with gross unrealized losses
totaled $288 million, a decrease of 7.4% compared to $311 million as of December 31, 2009. As of December 31, 2010,
gross unrealized losses for our below investment grade Alt-A portfolio totaled $116 million, a decrease of 45.3%
compared to $212 million as of December 31, 2009. The improvement over prior year was primarily due to improved
valuations resulting from lower risk premiums, impairment write-downs and principal collections. For our below
investment grade Alt-A securities with gross unrealized gains of $20 million, we have recognized cumulative write-
downs in earnings totaling $45 million as of December 31, 2010.
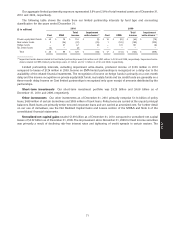
As of December 31, 2010, the fair value of our below investment grade Subprime securities with gross unrealized
losses totaled $796 million, an increase of 10.2% compared to $722 million as of December 31, 2009. As of December 31,
2010, gross unrealized losses for our below investment grade Subprime portfolio totaled $438 million, a decrease of
48.4% compared to $849 million as of December 31, 2009. The improvement over prior year was primarily due to
improved valuations resulting from lower risk premiums, impairment write-downs, sales and principal collections,
partially offset by downgrades of certain Subprime securities to below investment grade during 2010. For our below
investment grade Subprime with gross unrealized gains totaling $4 million, we have recognized cumulative write-downs
in earnings totaling $95 million as of December 31, 2010.
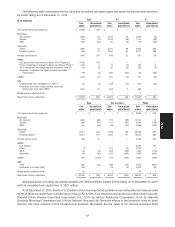
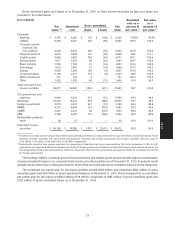
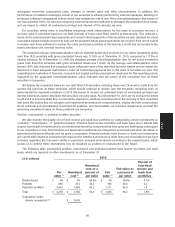
The credit loss evaluation for Alt-A and Subprime securities with gross unrealized losses is performed in two
phases. The first phase estimates the future cash flows of the entire securitization trust from which our security was
issued. A critical part of this estimate involves forecasting default rates and loss severities of the residential mortgage
loans that collateralize the securitization trust. The factors that affect the default rates and loss severities include, but are
75
MD&A