Allstate 2011 Annual Report Download - page 204
Download and view the complete annual report
Please find page 204 of the 2011 Allstate annual report below. You can navigate through the pages in the report by either clicking on the pages listed below, or by using the keyword search tool below to find specific information within the annual report.-
 1
1 -
2
-
3
-
4
-
5
-
6
-
7
-
8
-
9
-
10
-
11
-
12
-
13
-
14
-
15
-
16
-
17
-
18
-
19
-
20
-
21
-
22
-
23
-
24
-
25
-
26
-
27
-
28
-
29
-
30
-
31
-
32
-
33
-
34
-
35
-
36
-
37
-
38
-
39
-
40
-
41
-
42
-
43
-
44
-
45
-
46
-
47
-
48
-
49
-
50
-
51
-
52
-
53
-
54
-
55
-
56
-
57
-
58
-
59
-
60
-
61
-
62
-
63
-
64
-
65
-
66
-
67
-
68
-
69
-
70
-
71
-
72
-
73
-
74
-
75
-
76
-
77
-
78
-
79
-
80
-
81
-
82
-
83
-
84
-
85
-
86
-
87
-
88
-
89
-
90
-
91
-
92
-
93
-
94
-
95
-
96
-
97
-
98
-
99
-
100
-
101
-
102
-
103
-
104
-
105
-
106
-
107
-
108
-
109
-
110
-
111
-
112
-
113
-
114
-
115
-
116
-
117
-
118
-
119
-
120
-
121
-
122
-
123
-
124
-
125
-
126
-
127
-
128
-
129
-
130
-
131
-
132
-
133
-
134
-
135
-
136
-
137
-
138
-
139
-
140
-
141
-
142
-
143
-
144
-
145
-
146
-
147
-
148
-
149
-
150
-
151
-
152
-
153
-
154
-
155
-
156
-
157
-
158
-
159
-
160
-
161
-
162
-
163
-
164
-
165
-
166
-
167
-
168
-
169
-
170
-
171
-
172
-
173
-
174
-
175
-
176
-
177
-
178
-
179
-
180
-
181
-
182
-
183
-
184
-
185
-
186
-
187
-
188
-
189
-
190
-
191
-
192
-
193
-
 194
194 -
 195
195 -
 196
196 -
 197
197 -
 198
198 -
 199
199 -
 200
200 -
 201
201 -
 202
202 -
 203
203 -
 204
204 -
 205
205 -
 206
206 -
 207
207 -
 208
208 -
 209
209 -
 210
210 -
 211
211 -
 212
212 -
 213
213 -
 214
214 -
215
-
216
-
217
-
218
-
219
-
220
-
221
-
222
-
223
-
224
-
225
-
226
-
227
-
228
-
229
-
230
-
231
-
232
-
233
-
234
-
235
-
236
-
237
-
238
-
239
-
240
-
241
-
242
-
243
-
244
-
245
-
246
-
247
-
248
-
249
-
250
-
251
-
252
-
253
-
254
-
255
-
256
-
257
-
258
-
259
-
260
-
261
-
262
-
263
-
264
-
265
-
266
-
267
-
268
-
269
-
270
-
271
-
272
-
273
-
274
-
275
-
276
 |
 |

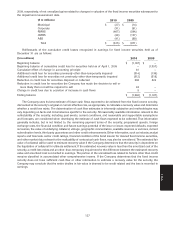
Disclosure of Supplementary Pro Forma Information for Business Combinations
In December 2010, the FASB issued disclosure guidance for entities that enter into business combinations that are
material. The guidance specifies that if an entity presents comparative financial statements, the entity should disclose
proforma revenue and earnings of the combined entity as though the business combination that occurred during the
current year had occurred as of the beginning of the comparable prior annual reporting period only. The guidance
expands the supplemental pro forma disclosures to include a description of the nature and amount of material,
nonrecurring pro forma adjustments directly attributable to the business combination. The guidance is effective
prospectively for business combinations entered into on or after the beginning of the first annual reporting period
beginning on or after December 15, 2010, with early adoption permitted. The Company will adopt the guidance for any
business combinations entered into on or after January 1, 2011.
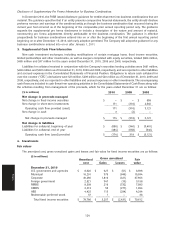
3. Supplemental Cash Flow Information
Non-cash investment exchanges, including modifications of certain mortgage loans, fixed income securities,
limited partnerships and other investments, as well as mergers completed with equity securities, totaled $664 million,
$485 million and $37 million for the years ended December 31, 2010, 2009 and 2008, respectively.
Liabilities for collateral received in conjunction with the Company’s securities lending activities were $461 million,
$449 million and $320 million as of December 31, 2010, 2009 and 2008, respectively, and are reported in other liabilities
and accrued expenses in the Consolidated Statements of Financial Position. Obligations to return cash collateral for
over-the-counter (‘‘OTC’’) derivatives were $23 million, $209 million and $20 million as of December 31, 2010, 2009 and
2008, respectively, and are reported in other liabilities and accrued expenses or other investments. The accompanying
cash flows are included in cash flows from operating activities in the Consolidated Statements of Cash Flows along with
the activities resulting from management of the proceeds, which for the years ended December 31 are as follows:
($ in millions) 2010 2009 2008
Net change in proceeds managed
Net change in fixed income securities $ — $ — $ 559
Net change in short-term investments 171 (316) 2,562
Operating cash flow provided (used) 171 (316) 3,121
Net change in cash 3 (2) —
Net change in proceeds managed $ 174 $ (318) $ 3,121
Net change in liabilities
Liabilities for collateral, beginning of year $ (658) $ (340) $ (3,461)
Liabilities for collateral, end of year (484) (658) (340)
Operating cash flow (used) provided $ (174) $ 318 $ (3,121)
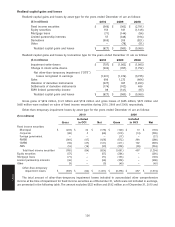
4. Investments
Fair values
The amortized cost, gross unrealized gains and losses and fair value for fixed income securities are as follows:
($ in millions) Gross unrealized
Amortized Fair
cost Gains Losses value
December 31, 2010
U.S. government and agencies $ 8,320 $ 327 $ (51) $ 8,596
Municipal 16,201 379 (646) 15,934
Corporate 36,260 1,816 (421) 37,655
Foreign government 2,821 347 (10) 3,158
RMBS 8,509 216 (732) 7,993
CMBS 2,213 58 (277) 1,994
ABS 4,425 113 (294) 4,244
Redeemable preferred stock 37 1 — 38
Total fixed income securities $ 78,786 $ 3,257 $ (2,431) $ 79,612
124
Notes