Allstate 2011 Annual Report Download - page 269
Download and view the complete annual report
Please find page 269 of the 2011 Allstate annual report below. You can navigate through the pages in the report by either clicking on the pages listed below, or by using the keyword search tool below to find specific information within the annual report.-
 1
1 -
2
-
3
-
4
-
5
-
6
-
7
-
8
-
9
-
10
-
11
-
12
-
13
-
14
-
15
-
16
-
17
-
18
-
19
-
20
-
21
-
22
-
23
-
24
-
25
-
26
-
27
-
28
-
29
-
30
-
31
-
32
-
33
-
34
-
35
-
36
-
37
-
38
-
39
-
40
-
41
-
42
-
43
-
44
-
45
-
46
-
47
-
48
-
49
-
50
-
51
-
52
-
53
-
54
-
55
-
56
-
57
-
58
-
59
-
60
-
61
-
62
-
63
-
64
-
65
-
66
-
67
-
68
-
69
-
70
-
71
-
72
-
73
-
74
-
75
-
76
-
77
-
78
-
79
-
80
-
81
-
82
-
83
-
84
-
85
-
86
-
87
-
88
-
89
-
90
-
91
-
92
-
93
-
94
-
95
-
96
-
97
-
98
-
99
-
100
-
101
-
102
-
103
-
104
-
105
-
106
-
107
-
108
-
109
-
110
-
111
-
112
-
113
-
114
-
115
-
116
-
117
-
118
-
119
-
120
-
121
-
122
-
123
-
124
-
125
-
126
-
127
-
128
-
129
-
130
-
131
-
132
-
133
-
134
-
135
-
136
-
137
-
138
-
139
-
140
-
141
-
142
-
143
-
144
-
145
-
146
-
147
-
148
-
149
-
150
-
151
-
152
-
153
-
154
-
155
-
156
-
157
-
158
-
159
-
160
-
161
-
162
-
163
-
164
-
165
-
166
-
167
-
168
-
169
-
170
-
171
-
172
-
173
-
174
-
175
-
176
-
177
-
178
-
179
-
180
-
181
-
182
-
183
-
184
-
185
-
186
-
187
-
188
-
189
-
190
-
191
-
192
-
193
-
194
-
195
-
196
-
197
-
198
-
199
-
200
-
201
-
202
-
203
-
204
-
205
-
206
-
207
-
208
-
209
-
210
-
211
-
212
-
213
-
214
-
215
-
216
-
217
-
218
-
219
-
220
-
221
-
222
-
223
-
224
-
225
-
226
-
227
-
228
-
229
-
230
-
231
-
232
-
233
-
234
-
235
-
236
-
237
-
238
-
239
-
240
-
241
-
242
-
243
-
244
-
245
-
246
-
247
-
248
-
249
-
250
-
251
-
252
-
253
-
254
-
255
-
256
-
257
-
258
-
 259
259 -
 260
260 -
 261
261 -
 262
262 -
 263
263 -
 264
264 -
 265
265 -
 266
266 -
 267
267 -
 268
268 -
 269
269 -
 270
270 -
 271
271 -
 272
272 -
 273
273 -
 274
274 -
 275
275 -
 276
276
 |
 |

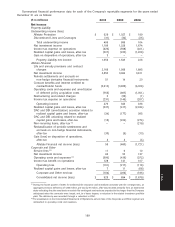
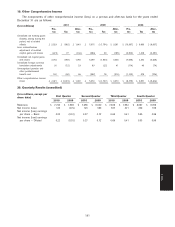
Summarized financial performance data for each of the Company’s reportable segments for the years ended
December 31 are as follows:
($ in millions) 2010 2009 2008
Net income
Property-Liability
Underwriting income (loss)
Allstate Protection $ 526 $ 1,027 $ 189
Discontinued Lines and Coverages (31) (32) (25)
Total underwriting income 495 995 164
Net investment income 1,189 1,328 1,674
Income tax expense on operations (426) (558) (401)
Realized capital gains and losses, after-tax (207) (222) (1,209)
Gain on disposition of operations, after-tax 3 — —
Property-Liability net income 1,054 1,543 228
Allstate Financial
Life and annuity premiums and contract
charges 2,168 1,958 1,895
Net investment income 2,853 3,064 3,811
Periodic settlements and accruals on
non-hedge derivative financial instruments 51 14 20
Contract benefits and interest credited to
contractholder funds (3,613) (3,655) (4,029)
Operating costs and expenses and amortization
of deferred policy acquisition costs (755) (867) (1,051)
Restructuring and related charges 3 (25) (1)
Income tax expense on operations (231) (149) (207)
Operating income 476 340 438
Realized capital gains and losses, after-tax (337) (417) (2,034)
DAC and DSI (amortization) accretion related to
realized capital gains and losses, after-tax (34) (177) 385
DAC and DSI unlocking related to realized
capital gains and losses, after-tax (18) (224) (274)
Non-recurring items, after-tax (1) — — (219)
Reclassification of periodic settlements and
accruals on non-hedge financial instruments,
after-tax (33) (9) (13)
Gain (loss) on disposition of operations,
after-tax 4 4 (4)
Allstate Financial net income (loss) 58 (483) (1,721)
Corporate and Other
Service fees (2) 11 9 10
Net investment income 60 52 137
Operating costs and expenses (2) (390) (419) (372)
Income tax benefit on operations 128 141 107
Operating loss (191) (217) (118)
Realized capital gains and losses, after-tax 7 11 (68)
Corporate and Other net loss (184) (206) (186)
Consolidated net income (loss) $ 928 $ 854 $ (1,679)
(1) During the fourth quarter of 2008, for traditional life insurance and immediate annuities with life contingencies, an
aggregate premium deficiency of $336 million, pre-tax ($219 million, after-tax) resulted primarily from an experience
study indicating that the annuitants on certain life-contingent contracts are projected to live longer than the Company
anticipated when the contracts were issued, and, to a lesser degree, a reduction in the related investment portfolio
yield. The deficiency was recorded through a reduction in DAC.
(2) For presentation in the Consolidated Statements of Operations, service fees of the Corporate and Other segment are
reclassified to operating costs and expenses.
189
Notes