Allstate 2011 Annual Report Download - page 151
Download and view the complete annual report
Please find page 151 of the 2011 Allstate annual report below. You can navigate through the pages in the report by either clicking on the pages listed below, or by using the keyword search tool below to find specific information within the annual report.-
 1
1 -
2
-
3
-
4
-
5
-
6
-
7
-
8
-
9
-
10
-
11
-
12
-
13
-
14
-
15
-
16
-
17
-
18
-
19
-
20
-
21
-
22
-
23
-
24
-
25
-
26
-
27
-
28
-
29
-
30
-
31
-
32
-
33
-
34
-
35
-
36
-
37
-
38
-
39
-
40
-
41
-
42
-
43
-
44
-
45
-
46
-
47
-
48
-
49
-
50
-
51
-
52
-
53
-
54
-
55
-
56
-
57
-
58
-
59
-
60
-
61
-
62
-
63
-
64
-
65
-
66
-
67
-
68
-
69
-
70
-
71
-
72
-
73
-
74
-
75
-
76
-
77
-
78
-
79
-
80
-
81
-
82
-
83
-
84
-
85
-
86
-
87
-
88
-
89
-
90
-
91
-
92
-
93
-
94
-
95
-
96
-
97
-
98
-
99
-
100
-
101
-
102
-
103
-
104
-
105
-
106
-
107
-
108
-
109
-
110
-
111
-
112
-
113
-
114
-
115
-
116
-
117
-
118
-
119
-
120
-
121
-
122
-
123
-
124
-
125
-
126
-
127
-
128
-
129
-
130
-
131
-
132
-
133
-
134
-
135
-
136
-
137
-
138
-
139
-
140
-
 141
141 -
 142
142 -
 143
143 -
 144
144 -
 145
145 -
 146
146 -
 147
147 -
 148
148 -
 149
149 -
 150
150 -
 151
151 -
 152
152 -
 153
153 -
 154
154 -
 155
155 -
 156
156 -
 157
157 -
 158
158 -
 159
159 -
 160
160 -
 161
161 -
162
-
163
-
164
-
165
-
166
-
167
-
168
-
169
-
170
-
171
-
172
-
173
-
174
-
175
-
176
-
177
-
178
-
179
-
180
-
181
-
182
-
183
-
184
-
185
-
186
-
187
-
188
-
189
-
190
-
191
-
192
-
193
-
194
-
195
-
196
-
197
-
198
-
199
-
200
-
201
-
202
-
203
-
204
-
205
-
206
-
207
-
208
-
209
-
210
-
211
-
212
-
213
-
214
-
215
-
216
-
217
-
218
-
219
-
220
-
221
-
222
-
223
-
224
-
225
-
226
-
227
-
228
-
229
-
230
-
231
-
232
-
233
-
234
-
235
-
236
-
237
-
238
-
239
-
240
-
241
-
242
-
243
-
244
-
245
-
246
-
247
-
248
-
249
-
250
-
251
-
252
-
253
-
254
-
255
-
256
-
257
-
258
-
259
-
260
-
261
-
262
-
263
-
264
-
265
-
266
-
267
-
268
-
269
-
270
-
271
-
272
-
273
-
274
-
275
-
276
 |
 |

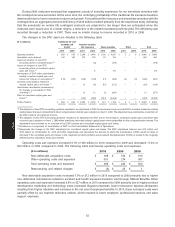
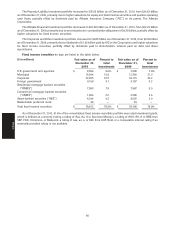
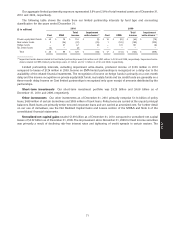
Our aggregate limited partnership exposure represented 3.8% and 2.8% of total invested assets as of December 31,
2010 and 2009, respectively.
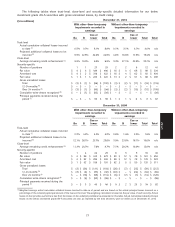
The following table shows the results from our limited partnership interests by fund type and accounting
classification for the years ended December 31.
2010 2009
($ in millions)
Total Impairment Total Impairment
Cost EMA income write-downs (1) Cost EMA income write-downs (1)
Private equity/debt funds $ 40 $ 76 $ 116 $ (9) $ 16 $ (61) $ (45) $ (79)
Real estate funds 2 (34) (32) (35) 1 (181) (180) (223)
Hedge funds — 47 47 (2) — 101 101 (6)
Tax credit funds (2) — (2) — — — — —
Total $ 40 $ 89 $ 129 $ (46) $ 17 $ (141) $ (124) $ (308)
(1) Impairment write-downs related to Cost limited partnerships were $45 million and $297 million in 2010 and 2009, respectively. Impairment write-
downs related to EMA limited partnerships were $1 million and $11 million in 2010 and 2009, respectively.
Limited partnership interests, excluding impairment write-downs, produced income of $129 million in 2010
compared to losses of $124 million in 2009. Income on EMA limited partnerships is recognized on a delay due to the
availability of the related financial statements. The recognition of income on hedge funds is primarily on a one-month
delay and the income recognition on private equity/debt funds, real estate funds and tax credit funds are generally on a
three-month delay. Income on Cost limited partnerships is recognized only upon receipt of amounts distributed by the
partnerships.
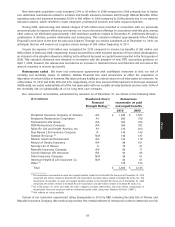
Short-term investments Our short-term investment portfolio was $3.28 billion and $3.06 billion as of
December 31, 2010 and 2009, respectively.
Other investments Our other investments as of December 31, 2010 primarily comprise $1.14 billion of policy
loans, $439 million of certain derivatives and $363 million of bank loans. Policy loans are carried at the unpaid principal
balances. Bank loans are primarily senior secured corporate loans and are carried at amortized cost. For further detail
on our use of derivatives, see the Net Realized Capital Gains and Losses section of the MD&A and Note 6 of the
consolidated financial statements.
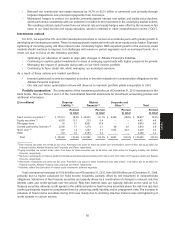
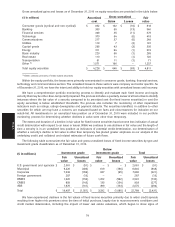
Unrealized net capital gains totaled $1.39 billion as of December 31, 2010 compared to unrealized net capital
losses of $2.32 billion as of December 31, 2009. The improvement since December 31, 2009 for fixed income securities
was primarily a result of declining risk-free interest rates and tightening of credit spreads in certain sectors. The
71
MD&A