Allstate 2011 Annual Report Download - page 180
Download and view the complete annual report
Please find page 180 of the 2011 Allstate annual report below. You can navigate through the pages in the report by either clicking on the pages listed below, or by using the keyword search tool below to find specific information within the annual report.-
 1
1 -
2
-
3
-
4
-
5
-
6
-
7
-
8
-
9
-
10
-
11
-
12
-
13
-
14
-
15
-
16
-
17
-
18
-
19
-
20
-
21
-
22
-
23
-
24
-
25
-
26
-
27
-
28
-
29
-
30
-
31
-
32
-
33
-
34
-
35
-
36
-
37
-
38
-
39
-
40
-
41
-
42
-
43
-
44
-
45
-
46
-
47
-
48
-
49
-
50
-
51
-
52
-
53
-
54
-
55
-
56
-
57
-
58
-
59
-
60
-
61
-
62
-
63
-
64
-
65
-
66
-
67
-
68
-
69
-
70
-
71
-
72
-
73
-
74
-
75
-
76
-
77
-
78
-
79
-
80
-
81
-
82
-
83
-
84
-
85
-
86
-
87
-
88
-
89
-
90
-
91
-
92
-
93
-
94
-
95
-
96
-
97
-
98
-
99
-
100
-
101
-
102
-
103
-
104
-
105
-
106
-
107
-
108
-
109
-
110
-
111
-
112
-
113
-
114
-
115
-
116
-
117
-
118
-
119
-
120
-
121
-
122
-
123
-
124
-
125
-
126
-
127
-
128
-
129
-
130
-
131
-
132
-
133
-
134
-
135
-
136
-
137
-
138
-
139
-
140
-
141
-
142
-
143
-
144
-
145
-
146
-
147
-
148
-
149
-
150
-
151
-
152
-
153
-
154
-
155
-
156
-
157
-
158
-
159
-
160
-
161
-
162
-
163
-
164
-
165
-
166
-
167
-
168
-
169
-
 170
170 -
 171
171 -
 172
172 -
 173
173 -
 174
174 -
 175
175 -
 176
176 -
 177
177 -
 178
178 -
 179
179 -
 180
180 -
 181
181 -
 182
182 -
 183
183 -
 184
184 -
 185
185 -
 186
186 -
 187
187 -
 188
188 -
 189
189 -
 190
190 -
191
-
192
-
193
-
194
-
195
-
196
-
197
-
198
-
199
-
200
-
201
-
202
-
203
-
204
-
205
-
206
-
207
-
208
-
209
-
210
-
211
-
212
-
213
-
214
-
215
-
216
-
217
-
218
-
219
-
220
-
221
-
222
-
223
-
224
-
225
-
226
-
227
-
228
-
229
-
230
-
231
-
232
-
233
-
234
-
235
-
236
-
237
-
238
-
239
-
240
-
241
-
242
-
243
-
244
-
245
-
246
-
247
-
248
-
249
-
250
-
251
-
252
-
253
-
254
-
255
-
256
-
257
-
258
-
259
-
260
-
261
-
262
-
263
-
264
-
265
-
266
-
267
-
268
-
269
-
270
-
271
-
272
-
273
-
274
-
275
-
276
 |
 |

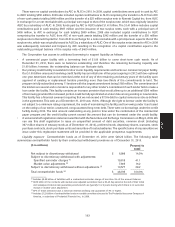
CAPITAL RESOURCES AND LIQUIDITY
Capital resources consist of shareholders’ equity and debt, representing funds deployed or available to be
deployed to support business operations or for general corporate purposes. The following table summarizes our capital
resources as of December 31.
($ in millions) 2010 2009 2008
Common stock, retained income and other
shareholders’ equity items $ 19,200 $ 18,798 $ 17,442
Accumulated other comprehensive loss (184) (2,106) (4,801)
Total shareholders’ equity 19,016 16,692 12,641
Debt 5,908 5,910 5,659
Total capital resources $ 24,924 $ 22,602 $ 18,300
Ratio of debt to shareholders’ equity 31.1% 35.4% 44.8%
Ratio of debt to capital resources 23.7% 26.1% 30.9%
Shareholders’ equity increased in 2010, primarily due to unrealized net capital gains on investments and net income,
partially offset by dividends paid to shareholders and share repurchases. Shareholders’ equity increased in 2009, due
primarily to decreases in unrealized net capital losses on investments and net income, partially offset by dividends paid
to shareholders.
Debt decreased $2 million in 2010 due to decreases in long-term debt. Debt increased $251 million in 2009 due to
net increases in long-term debt. In May 2009, we issued $300 million of 6.20% Senior Notes due 2014 and $700 million of
7.45% Senior Notes due 2019. The proceeds of this issuance were used for general corporate purposes, including to
facilitate the repayment of the $750 million of 7.20% Senior Notes that matured on December 1, 2009. Except for
$42 million in long-term debt related to the synthetic leases scheduled to mature in 2011, we do not have any required
principal payments until 2012 when $350 million of 6.125% Senior Notes are due. For further information on debt
issuances, see Note 11 of the consolidated financial statements.
As of December 31, 2010 and 2009, there were no outstanding commercial paper borrowings.
Share repurchases In November 2010, we commenced a $1.00 billion share repurchase program. As of
December 31, 2010, this program had $840 million remaining and is expected to be completed by March 31, 2012.
Since 1995, we have acquired 463 million shares of our common stock at a cost of $19.25 billion, primarily as part of
various stock repurchase programs. We have reissued 97 million shares since 1995, primarily associated with our equity
incentive plans, the 1999 acquisition of American Heritage Life Investment Corporation and the 2001 redemption of
certain mandatorily redeemable preferred securities. Since 1995, total shares outstanding has decreased by 363 million
shares or 40.5%, primarily due to our repurchase programs.
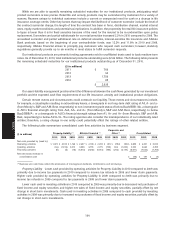
Financial ratings and strength The following table summarizes our debt, commercial paper and insurance
financial strength ratings as of December 31, 2010.
Standard
Moody’s & Poor’s A.M. Best
The Allstate Corporation (senior long-term debt) A3 A- a-
The Allstate Corporation (commercial paper) P-2 A-2 AMB-1
Allstate Insurance Company (insurance financial strength) Aa3 AA- A+
Allstate Life Insurance Company (insurance financial strength) A1 A+ A+
Our ratings are influenced by many factors including our operating and financial performance, asset quality,
liquidity, asset/liability management, overall portfolio mix, financial leverage (i.e., debt), exposure to risks such as
catastrophes and the current level of operating leverage.
On January 24, 2011, Moody’s affirmed The Allstate Corporation’s debt and commercial paper ratings of A3, and
P-2, respectively, AIC’s financial strength rating of Aa3 and ALIC’s financial strength rating of A1. The outlook for the
Moody’s ratings remained stable. On December 15, 2010, A.M. Best affirmed The Allstate Corporation’s debt and
commercial paper ratings of a- and AMB-1, respectively, as well as the A+ financial strength ratings of AIC and ALIC.
The outlook for The Allstate Corporation and AIC remained stable while the outlook for ALIC remained negative. On
November 17, 2010, S&P affirmed The Allstate Corporation’s debt and commercial paper ratings of A- and A-2,
100
MD&A