Allstate 2011 Annual Report Download - page 144
Download and view the complete annual report
Please find page 144 of the 2011 Allstate annual report below. You can navigate through the pages in the report by either clicking on the pages listed below, or by using the keyword search tool below to find specific information within the annual report.-
 1
1 -
2
-
3
-
4
-
5
-
6
-
7
-
8
-
9
-
10
-
11
-
12
-
13
-
14
-
15
-
16
-
17
-
18
-
19
-
20
-
21
-
22
-
23
-
24
-
25
-
26
-
27
-
28
-
29
-
30
-
31
-
32
-
33
-
34
-
35
-
36
-
37
-
38
-
39
-
40
-
41
-
42
-
43
-
44
-
45
-
46
-
47
-
48
-
49
-
50
-
51
-
52
-
53
-
54
-
55
-
56
-
57
-
58
-
59
-
60
-
61
-
62
-
63
-
64
-
65
-
66
-
67
-
68
-
69
-
70
-
71
-
72
-
73
-
74
-
75
-
76
-
77
-
78
-
79
-
80
-
81
-
82
-
83
-
84
-
85
-
86
-
87
-
88
-
89
-
90
-
91
-
92
-
93
-
94
-
95
-
96
-
97
-
98
-
99
-
100
-
101
-
102
-
103
-
104
-
105
-
106
-
107
-
108
-
109
-
110
-
111
-
112
-
113
-
114
-
115
-
116
-
117
-
118
-
119
-
120
-
121
-
122
-
123
-
124
-
125
-
126
-
127
-
128
-
129
-
130
-
131
-
132
-
133
-
 134
134 -
 135
135 -
 136
136 -
 137
137 -
 138
138 -
 139
139 -
 140
140 -
 141
141 -
 142
142 -
 143
143 -
 144
144 -
 145
145 -
 146
146 -
 147
147 -
 148
148 -
 149
149 -
 150
150 -
 151
151 -
 152
152 -
 153
153 -
 154
154 -
155
-
156
-
157
-
158
-
159
-
160
-
161
-
162
-
163
-
164
-
165
-
166
-
167
-
168
-
169
-
170
-
171
-
172
-
173
-
174
-
175
-
176
-
177
-
178
-
179
-
180
-
181
-
182
-
183
-
184
-
185
-
186
-
187
-
188
-
189
-
190
-
191
-
192
-
193
-
194
-
195
-
196
-
197
-
198
-
199
-
200
-
201
-
202
-
203
-
204
-
205
-
206
-
207
-
208
-
209
-
210
-
211
-
212
-
213
-
214
-
215
-
216
-
217
-
218
-
219
-
220
-
221
-
222
-
223
-
224
-
225
-
226
-
227
-
228
-
229
-
230
-
231
-
232
-
233
-
234
-
235
-
236
-
237
-
238
-
239
-
240
-
241
-
242
-
243
-
244
-
245
-
246
-
247
-
248
-
249
-
250
-
251
-
252
-
253
-
254
-
255
-
256
-
257
-
258
-
259
-
260
-
261
-
262
-
263
-
264
-
265
-
266
-
267
-
268
-
269
-
270
-
271
-
272
-
273
-
274
-
275
-
276
 |
 |

of recoverability on an individual and aggregate basis, and a provision for uncollectible reinsurance is recorded if
needed. No amounts have been deemed unrecoverable in the three-years ended December 31, 2010.
We enter into certain intercompany reinsurance transactions for the Allstate Financial operations in order to
maintain underwriting control and manage insurance risk among various legal entities. These reinsurance agreements
have been approved by the appropriate regulatory authorities. All significant intercompany transactions have been
eliminated in consolidation.
INVESTMENTS 2010 HIGHLIGHTS
• Investments as of December 31, 2010 totaled $100.48 billion, an increase of 0.7% from $99.83 billion as of
December 31, 2009.
• Unrealized net capital gains totaled $1.39 billion as of December 31, 2010, improving from unrealized net capital
losses of $2.32 billion as of December 31, 2009.
• As of December 31, 2010, the fair value for our below investment grade fixed income securities with gross
unrealized losses totaled $3.29 billion compared to $3.51 billion as of December 31, 2009. The gross unrealized
losses for these securities totaled $1.08 billion as of December 31, 2010, an improvement of 40.4% from $1.81 billion
as of December 31, 2009.
• Net investment income was $4.10 billion in 2010, a decrease of 7.7% from $4.44 billion in 2009.
• Net realized capital losses were $827 million in 2010 compared to net realized capital losses of $583 million in 2009.
• Derivative net realized capital losses totaled $601 million in 2010 compared to net realized capital gains of
$205 million in 2009. Derivative net realized capital losses in 2010 resulted primarily from our risk management
actions.
• During 2010, our fixed income and mortgage loan portfolio generated $10.19 billion of cash flows from interest and
maturities.
INVESTMENTS
Overview and strategy The return on our investment portfolios is an important component of our financial
results. Investment portfolios are segmented between the Property-Liability, Allstate Financial and Corporate and Other
operations. While taking into consideration the investment portfolio in aggregate, we manage the underlying portfolios
based upon the nature of each respective business and its corresponding liability structure.
We employ a strategic asset allocation approach which uses models that consider the nature of the liabilities and
risk tolerances, as well as the risk and return parameters of the various asset classes in which we invest. This asset
allocation is informed by our global economic and market outlook, as well as other inputs and constraints, including
diversification effects, duration, liquidity and capital considerations. Within the ranges set by the strategic asset
allocation model, tactical investment decisions are made in consideration of prevailing market conditions. We continue
to manage risks associated with interest rates, credit and credit spreads, equity markets, and real estate and municipal
bonds.
The Property-Liability portfolio’s investment strategy emphasizes protection of principal and consistent income
generation, within a total return framework. This approach, which has produced competitive returns over the long term,
is designed to ensure financial strength and stability for paying claims, while maximizing economic value and surplus
growth.
The Allstate Financial portfolio’s investment strategy focuses on the total return of assets needed to support the
underlying liabilities, asset-liability management and achieving an appropriate return on capital.
The Corporate and Other portfolio’s investment strategy balances the pursuit of competitive returns with the unique
liquidity needs of the portfolio in relation to the overall corporate capital structure. The portfolio is primarily invested in
high quality, liquid fixed income and short-term securities with additional investments in less liquid holdings in order to
enhance overall returns.
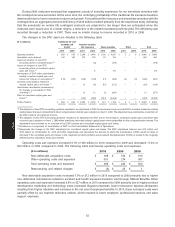
Risk mitigation
We continue to focus our strategic risk mitigation efforts towards managing interest rate, credit and credit spreads,
equity and real estate and municipal bond investment risks, while our return optimization efforts focus on investing in
new opportunities to generate income and capital appreciation. As a result, during 2010 we took the following actions:
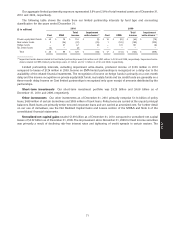
• Reduced our municipal bond exposure by 25.3% or $5.48 billion of amortized cost primarily through targeted
dispositions, prepayments and scheduled maturities.
64
MD&A