Allstate 2011 Annual Report Download - page 220
Download and view the complete annual report
Please find page 220 of the 2011 Allstate annual report below. You can navigate through the pages in the report by either clicking on the pages listed below, or by using the keyword search tool below to find specific information within the annual report.-
 1
1 -
2
-
3
-
4
-
5
-
6
-
7
-
8
-
9
-
10
-
11
-
12
-
13
-
14
-
15
-
16
-
17
-
18
-
19
-
20
-
21
-
22
-
23
-
24
-
25
-
26
-
27
-
28
-
29
-
30
-
31
-
32
-
33
-
34
-
35
-
36
-
37
-
38
-
39
-
40
-
41
-
42
-
43
-
44
-
45
-
46
-
47
-
48
-
49
-
50
-
51
-
52
-
53
-
54
-
55
-
56
-
57
-
58
-
59
-
60
-
61
-
62
-
63
-
64
-
65
-
66
-
67
-
68
-
69
-
70
-
71
-
72
-
73
-
74
-
75
-
76
-
77
-
78
-
79
-
80
-
81
-
82
-
83
-
84
-
85
-
86
-
87
-
88
-
89
-
90
-
91
-
92
-
93
-
94
-
95
-
96
-
97
-
98
-
99
-
100
-
101
-
102
-
103
-
104
-
105
-
106
-
107
-
108
-
109
-
110
-
111
-
112
-
113
-
114
-
115
-
116
-
117
-
118
-
119
-
120
-
121
-
122
-
123
-
124
-
125
-
126
-
127
-
128
-
129
-
130
-
131
-
132
-
133
-
134
-
135
-
136
-
137
-
138
-
139
-
140
-
141
-
142
-
143
-
144
-
145
-
146
-
147
-
148
-
149
-
150
-
151
-
152
-
153
-
154
-
155
-
156
-
157
-
158
-
159
-
160
-
161
-
162
-
163
-
164
-
165
-
166
-
167
-
168
-
169
-
170
-
171
-
172
-
173
-
174
-
175
-
176
-
177
-
178
-
179
-
180
-
181
-
182
-
183
-
184
-
185
-
186
-
187
-
188
-
189
-
190
-
191
-
192
-
193
-
194
-
195
-
196
-
197
-
198
-
199
-
200
-
201
-
202
-
203
-
204
-
205
-
206
-
207
-
208
-
209
-
 210
210 -
 211
211 -
 212
212 -
 213
213 -
 214
214 -
 215
215 -
 216
216 -
 217
217 -
 218
218 -
 219
219 -
 220
220 -
 221
221 -
 222
222 -
 223
223 -
 224
224 -
 225
225 -
 226
226 -
 227
227 -
 228
228 -
 229
229 -
 230
230 -
231
-
232
-
233
-
234
-
235
-
236
-
237
-
238
-
239
-
240
-
241
-
242
-
243
-
244
-
245
-
246
-
247
-
248
-
249
-
250
-
251
-
252
-
253
-
254
-
255
-
256
-
257
-
258
-
259
-
260
-
261
-
262
-
263
-
264
-
265
-
266
-
267
-
268
-
269
-
270
-
271
-
272
-
273
-
274
-
275
-
276
 |
 |

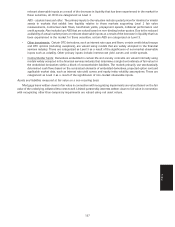
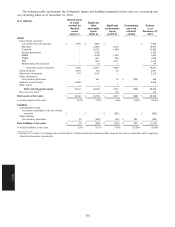
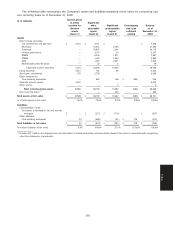
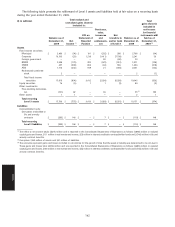
The following table presents the rollforward of Level 3 assets and liabilities held at fair value on a recurring basis
during the year ended December 31, 2010.
Total realized and
($ in millions) unrealized gains (losses)
included in:
OCI on Purchases,
Balance as of Statement of sales, Transfers Transfers Balance as of
December 31, Net Financial issuances and into out of December 31,
2009 income (1) Position settlements, net Level 3 Level 3 2010
Assets
Fixed income securities:
Municipal $ 2,706 $ (40) $ 46 $ (588) $ 38 $ (146) $ 2,016
Corporate 2,241 5 115 (167) 444 (730) 1,908
Foreign government 20 — — (20) — — —
RMBS 1,671 (421) 736 (135) — (57) 1,794
CMBS 1,404 (233) 592 (526) 107 (421) 923
ABS 2,001 55 275 553 — (467) 2,417
Redeemable preferred stock 2 — — (1) — — 1
Total fixed income securities 10,045 (634) 1,764 (884) 589 (1,821) 9,059
Equity securities 69 8 5 (12) — (7) 63
Other investments:
Free-standing derivatives, net 55 (202) — 126 — — (21) (2)
Other assets 2 (1) — — — — 1
Total recurring
Level 3 assets $ 10,171 $ (829) $ 1,769 $ (770) $ 589 $ (1,828) $ 9,102
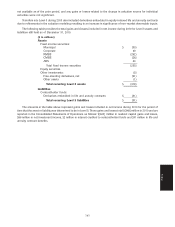
Liabilities
Contractholder funds:
Derivatives embedded in life and
annuity contracts $ (110) $ (31) $ — $ 3 $ (515) $ — $ (653)
Total recurring
Level 3 liabilities $ (110) $ (31) $ — $ 3 $ (515) $ — $ (653)
(1) The effect to net income totals $(860) million and is reported in the Consolidated Statements of Operations as follows: $(901) million in realized
capital gains and losses, $73 million in net investment income, $1 million in interest credited to contractholder funds and $31 million in life and
annuity contract benefits.
(2) Comprises $74 million of assets and $95 million of liabilities.
Transfers between level categorizations may occur due to changes in the availability of market observable inputs,
which generally are caused by changes in market conditions such as liquidity, trading volume or bid-ask spreads.
Transfers between level categorizations may also occur due to changes in the valuation source. For example, in
situations where a fair value quote is not provided by the Company’s independent third-party valuation service provider
and as a result the price is stale or has been replaced with a broker quote, the security is transferred into Level 3.
Transfers in and out of level categorizations are reported as having occurred at the beginning of the quarter in which the
transfer occurred. Therefore, for all transfers into Level 3, all realized and changes in unrealized gains and losses in the
quarter of transfer are reflected in the Level 3 rollforward table.
There were no transfers between Level 1 and Level 2 during 2010.
During 2010, certain CMBS and ABS were transferred into Level 2 from Level 3 as a result of increased liquidity in
the market and the availability of market observable quoted prices for similar assets. When transferring these securities
into Level 2, the Company did not change the source of fair value estimates or modify the estimates received from
independent third-party valuation service providers or the internal valuation approach. Accordingly, for securities
included within this group, there was no change in fair value in conjunction with the transfer resulting in a realized or
unrealized gain or loss.
Transfers into Level 3 during 2010, including those related to Corporate fixed income securities, included situations
where a fair value quote was not provided by the Company’s independent third-party valuation service provider and as a
result the price was stale or had been replaced with a broker quote resulting in the security being classified as Level 3.
Transfers out of Level 3 during 2010, including those related to Corporate fixed income securities, included situations
where a broker quote was used in the prior period and a fair value quote became available from the Company’s
independent third-party valuation service provider in the current period. A quote utilizing the new pricing source was
140
Notes