Allstate 2011 Annual Report Download - page 116
Download and view the complete annual report
Please find page 116 of the 2011 Allstate annual report below. You can navigate through the pages in the report by either clicking on the pages listed below, or by using the keyword search tool below to find specific information within the annual report.-
 1
1 -
2
-
3
-
4
-
5
-
6
-
7
-
8
-
9
-
10
-
11
-
12
-
13
-
14
-
15
-
16
-
17
-
18
-
19
-
20
-
21
-
22
-
23
-
24
-
25
-
26
-
27
-
28
-
29
-
30
-
31
-
32
-
33
-
34
-
35
-
36
-
37
-
38
-
39
-
40
-
41
-
42
-
43
-
44
-
45
-
46
-
47
-
48
-
49
-
50
-
51
-
52
-
53
-
54
-
55
-
56
-
57
-
58
-
59
-
60
-
61
-
62
-
63
-
64
-
65
-
66
-
67
-
68
-
69
-
70
-
71
-
72
-
73
-
74
-
75
-
76
-
77
-
78
-
79
-
80
-
81
-
82
-
83
-
84
-
85
-
86
-
87
-
88
-
89
-
90
-
91
-
92
-
93
-
94
-
95
-
96
-
97
-
98
-
99
-
100
-
101
-
102
-
103
-
104
-
105
-
 106
106 -
 107
107 -
 108
108 -
 109
109 -
 110
110 -
 111
111 -
 112
112 -
 113
113 -
 114
114 -
 115
115 -
 116
116 -
 117
117 -
 118
118 -
 119
119 -
 120
120 -
 121
121 -
 122
122 -
 123
123 -
 124
124 -
 125
125 -
 126
126 -
127
-
128
-
129
-
130
-
131
-
132
-
133
-
134
-
135
-
136
-
137
-
138
-
139
-
140
-
141
-
142
-
143
-
144
-
145
-
146
-
147
-
148
-
149
-
150
-
151
-
152
-
153
-
154
-
155
-
156
-
157
-
158
-
159
-
160
-
161
-
162
-
163
-
164
-
165
-
166
-
167
-
168
-
169
-
170
-
171
-
172
-
173
-
174
-
175
-
176
-
177
-
178
-
179
-
180
-
181
-
182
-
183
-
184
-
185
-
186
-
187
-
188
-
189
-
190
-
191
-
192
-
193
-
194
-
195
-
196
-
197
-
198
-
199
-
200
-
201
-
202
-
203
-
204
-
205
-
206
-
207
-
208
-
209
-
210
-
211
-
212
-
213
-
214
-
215
-
216
-
217
-
218
-
219
-
220
-
221
-
222
-
223
-
224
-
225
-
226
-
227
-
228
-
229
-
230
-
231
-
232
-
233
-
234
-
235
-
236
-
237
-
238
-
239
-
240
-
241
-
242
-
243
-
244
-
245
-
246
-
247
-
248
-
249
-
250
-
251
-
252
-
253
-
254
-
255
-
256
-
257
-
258
-
259
-
260
-
261
-
262
-
263
-
264
-
265
-
266
-
267
-
268
-
269
-
270
-
271
-
272
-
273
-
274
-
275
-
276
 |
 |

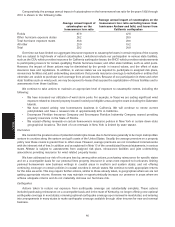
– increase in the renewal ratio in 2009 compared to 2008 in part driven by less non-renewal activity in coastal
states that are more susceptible to major catastrophes
– decrease in the net cost of our catastrophe reinsurance program
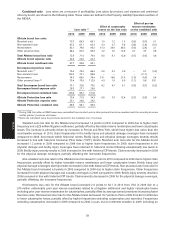
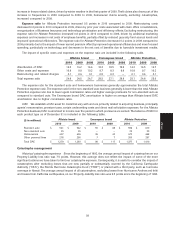
Rate changes that are indicated based on loss trend analysis to achieve a targeted return will continue to be
pursued. The following table shows the rate changes that were approved for homeowners, including rate changes
approved based on our net cost of reinsurance, and does not include rating plan enhancements, including the
introduction of discounts and surcharges, that result in no change in the overall rate level in the state.
# of States Countrywide (%) (1) State Specific (%) (2)(3)
2010 2009 2010 2009 2010 2009
Allstate brand (4) 32 40 7.0 8.4 10.0 10.7
Encompass brand (4) 23 36 0.7 4.4 1.4 5.9
(1) Represents the impact in the states where rate changes were approved during 2010 and 2009, respectively, as a percentage of total
countrywide prior year-end premiums written.
(2) Represents the impact in the states where rate changes were approved during 2010 and 2009, respectively, as a percentage of its
respective total prior year-end premiums written in those states.
(3) Based on historical premiums written in those states, rate changes approved for homeowners totaled $424 million in 2010 compared
to $534 million in 2009.
(4) Includes Washington D.C.
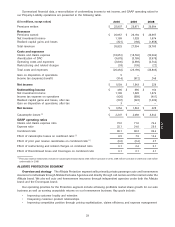
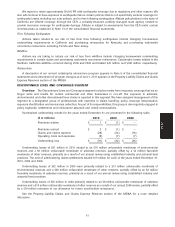
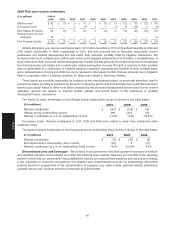
Underwriting results are shown in the following table.
($ in millions) 2010 2009 2008
Premiums written $ 25,906 $ 25,972 $ 26,584
Premiums earned $ 25,955 $ 26,195 $ 26,967
Claims and claims expense (18,923) (18,722) (20,046)
Amortization of DAC (3,678) (3,789) (3,975)
Other costs and expenses (2,795) (2,552) (2,735)
Restructuring and related charges (33) (105) (22)
Underwriting income $ 526 $ 1,027 $ 189
Catastrophe losses $ 2,207 $ 2,069 $ 3,342
Underwriting income (loss) by line of
business
Standard auto (1) $ 692 $ 987 $ 1,247
Non-standard auto 74 76 136
Homeowners (335) (125) (1,175)
Other personal lines (1) 95 89 (19)
Underwriting income $ 526 $ 1,027 $ 189
Underwriting income (loss) by brand
Allstate brand $ 569 $ 1,022 $ 220
Encompass brand (43) 5 (31)
Underwriting income $ 526 $ 1,027 $ 189
(1) During 2008, $45 million of IBNR losses were reclassified from standard auto to other personal lines to be consistent
with the recording of excess liability policies’ premiums and losses.
Allstate Protection experienced underwriting income of $526 million in 2010 compared to $1.03 billion in 2009,
primarily due to decreases in standard auto underwriting income and increases in homeowners underwriting losses,
partially offset by increases in other personal lines underwriting income. Standard auto underwriting income decreased
29.9% to an underwriting income of $692 million in 2010 from an underwriting income of $987 million in 2009 primarily
due to increases in auto claim frequency and expenses and a $25 million litigation settlement, partially offset by
favorable reserve reestimates and decreases in catastrophe losses. Homeowners underwriting loss increased
$210 million to an underwriting loss of $335 million in 2010 from an underwriting loss of $125 million in 2009 primarily
due to a $75 million unfavorable prior year reserve reestimate related to a litigation settlement and increases in
36
MD&A