Allstate 2011 Annual Report Download - page 118
Download and view the complete annual report
Please find page 118 of the 2011 Allstate annual report below. You can navigate through the pages in the report by either clicking on the pages listed below, or by using the keyword search tool below to find specific information within the annual report.-
 1
1 -
2
-
3
-
4
-
5
-
6
-
7
-
8
-
9
-
10
-
11
-
12
-
13
-
14
-
15
-
16
-
17
-
18
-
19
-
20
-
21
-
22
-
23
-
24
-
25
-
26
-
27
-
28
-
29
-
30
-
31
-
32
-
33
-
34
-
35
-
36
-
37
-
38
-
39
-
40
-
41
-
42
-
43
-
44
-
45
-
46
-
47
-
48
-
49
-
50
-
51
-
52
-
53
-
54
-
55
-
56
-
57
-
58
-
59
-
60
-
61
-
62
-
63
-
64
-
65
-
66
-
67
-
68
-
69
-
70
-
71
-
72
-
73
-
74
-
75
-
76
-
77
-
78
-
79
-
80
-
81
-
82
-
83
-
84
-
85
-
86
-
87
-
88
-
89
-
90
-
91
-
92
-
93
-
94
-
95
-
96
-
97
-
98
-
99
-
100
-
101
-
102
-
103
-
104
-
105
-
106
-
107
-
 108
108 -
 109
109 -
 110
110 -
 111
111 -
 112
112 -
 113
113 -
 114
114 -
 115
115 -
 116
116 -
 117
117 -
 118
118 -
 119
119 -
 120
120 -
 121
121 -
 122
122 -
 123
123 -
 124
124 -
 125
125 -
 126
126 -
 127
127 -
 128
128 -
129
-
130
-
131
-
132
-
133
-
134
-
135
-
136
-
137
-
138
-
139
-
140
-
141
-
142
-
143
-
144
-
145
-
146
-
147
-
148
-
149
-
150
-
151
-
152
-
153
-
154
-
155
-
156
-
157
-
158
-
159
-
160
-
161
-
162
-
163
-
164
-
165
-
166
-
167
-
168
-
169
-
170
-
171
-
172
-
173
-
174
-
175
-
176
-
177
-
178
-
179
-
180
-
181
-
182
-
183
-
184
-
185
-
186
-
187
-
188
-
189
-
190
-
191
-
192
-
193
-
194
-
195
-
196
-
197
-
198
-
199
-
200
-
201
-
202
-
203
-
204
-
205
-
206
-
207
-
208
-
209
-
210
-
211
-
212
-
213
-
214
-
215
-
216
-
217
-
218
-
219
-
220
-
221
-
222
-
223
-
224
-
225
-
226
-
227
-
228
-
229
-
230
-
231
-
232
-
233
-
234
-
235
-
236
-
237
-
238
-
239
-
240
-
241
-
242
-
243
-
244
-
245
-
246
-
247
-
248
-
249
-
250
-
251
-
252
-
253
-
254
-
255
-
256
-
257
-
258
-
259
-
260
-
261
-
262
-
263
-
264
-
265
-
266
-
267
-
268
-
269
-
270
-
271
-
272
-
273
-
274
-
275
-
276
 |
 |

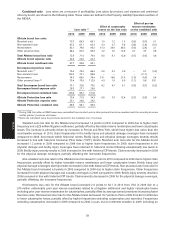
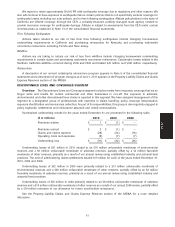
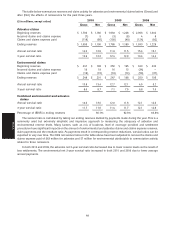
Combined ratio Loss ratios are a measure of profitability. Loss ratios by product, and expense and combined
ratios by brand, are shown in the following table. These ratios are defined in the Property-Liability Operations section of
the MD&A.
Effect of pre-tax
Effect of catastrophe reserve reestimates
Loss ratio (2) losses on the loss ratio on the combined ratio
2010 2009 2008 2010 2009 2008 2010 2009 2008
Allstate brand loss ratio:
Standard auto 70.7 69.3 68.1 1.0 1.2 1.5 (0.9) (0.3) 0.1
Non-standard auto 67.2 67.1 62.3 0.3 0.7 0.9 (3.6) (1.6) (0.1)
Homeowners 82.1 79.6 96.3 31.3 29.0 46.5 (0.3) (2.6) 2.1
Other personal lines 66.4 67.3 69.3 7.2 7.0 10.6 0.7 3.5 0.6
Total Allstate brand loss ratio 72.8 71.4 74.4 8.5 8.1 12.6 (0.7) (0.5) 0.6
Allstate brand expense ratio 24.9 24.5 24.7
Allstate brand combined ratio 97.7 95.9 99.1
Encompass brand loss ratio:
Standard auto (1) 75.4 75.4 66.3 0.8 0.3 0.9 — 0.7 (4.2)
Non-standard auto 100.0 74.1 88.9 — — — — (11.1) —
Homeowners 74.3 66.0 76.4 23.1 14.6 27.8 (1.3) (4.3) 0.4
Other personal lines (1) 73.4 75.9 112.9 4.3 1.9 8.9 (1.1) 5.6 33.1
Total Encompass brand loss ratio 75.1 72.6 73.0 8.2 4.7 9.1 (0.5) (0.7) (0.2)
Encompass brand expense ratio 28.5 27.1 28.8
Encompass brand combined ratio 103.6 99.7 101.8
Allstate Protection loss ratio 72.9 71.5 74.3 8.5 7.9 12.4 (0.7) (0.5) 0.6
Allstate Protection expense ratio 25.1 24.6 25.0
Allstate Protection combined ratio 98.0 96.1 99.3
(1) During 2008, $45 million of IBNR losses were reclassified from standard auto to other personal lines to be consistent with the recording of excess
liability policies’ premiums and losses.
(2) Ratios are calculated using the premiums earned for the respective line of business.
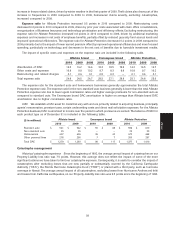
Standard auto loss ratio for the Allstate brand increased 1.4 points in 2010 compared to 2009 due to higher claim
frequency and a $25 million litigation settlement, partially offset by favorable reserve reestimates and lower catastrophe
losses. The increase is primarily driven by increases in Florida and New York, which have higher loss ratios than the
countrywide average. In 2010, claim frequencies in the bodily injury and physical damage coverages have increased
compared to 2009, but remain within historical norms. Bodily injury and physical damage coverages severity results
increased in line with historical Consumer Price Index (‘‘CPI’’) trends. Standard auto loss ratio for the Allstate brand
increased 1.2 points in 2009 compared to 2008 due to higher claim frequencies. In 2009, claim frequencies in the
physical damage and bodily injury coverages have returned to historical norms following exceptionally low levels in
2008. Bodily injury severity results in 2009 increased in line with historical CPI trends. Claims severity decreased in 2009
for the physical damage coverages, partially offsetting the increased frequencies.
Non-standard auto loss ratio for the Allstate brand increased 0.1 point in 2010 compared to 2009 due to higher claim
frequencies, partially offset by higher favorable reserve reestimates and lower catastrophe losses. Bodily injury and
physical damage coverages severity results increased in line with historical CPI trends. Non-standard auto loss ratio for
the Allstate brand increased 4.8 points in 2009 compared to 2008 due to higher claim frequencies. Claim frequencies
increased for both physical damage and casualty coverages in 2009 compared to 2008. Bodily injury severity results in
2009 increased in line with historical CPI trends. Claims severity decreased in 2009 for the physical damage coverages,
partially offsetting the increased frequencies.
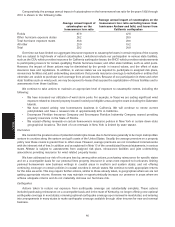
Homeowners loss ratio for the Allstate brand increased 2.5 points to 82.1 in 2010 from 79.6 in 2009 due to a
$75 million unfavorable prior year reserve reestimate related to a litigation settlement and higher catastrophe losses
including prior year reserve reestimates for catastrophes, partially offset by average earned premiums increasing faster
than loss costs. Homeowners loss ratio for the Allstate brand decreased 16.7 points to 79.6 in 2009 from 96.3 in 2008 due
to lower catastrophe losses, partially offset by higher frequencies excluding catastrophes and severities. Frequencies
excluding catastrophes increased in 2009 compared to 2008, in part, due to inclement weather in 2009, including an
38
MD&A