ADT 2006 Annual Report Download - page 99
Download and view the complete annual report
Please find page 99 of the 2006 ADT annual report below. You can navigate through the pages in the report by either clicking on the pages listed below, or by using the keyword search tool below to find specific information within the annual report.-
 1
1 -
2
-
3
-
4
-
5
-
6
-
7
-
8
-
9
-
10
-
11
-
12
-
13
-
14
-
15
-
16
-
17
-
18
-
19
-
20
-
21
-
22
-
23
-
24
-
25
-
26
-
27
-
28
-
29
-
30
-
31
-
32
-
33
-
34
-
35
-
36
-
37
-
38
-
39
-
40
-
41
-
42
-
43
-
44
-
45
-
46
-
47
-
48
-
49
-
50
-
51
-
52
-
53
-
54
-
55
-
56
-
57
-
58
-
59
-
60
-
61
-
62
-
63
-
64
-
65
-
66
-
67
-
68
-
69
-
70
-
71
-
72
-
73
-
74
-
75
-
76
-
77
-
78
-
79
-
80
-
81
-
82
-
83
-
84
-
85
-
86
-
87
-
88
-
 89
89 -
 90
90 -
 91
91 -
 92
92 -
 93
93 -
 94
94 -
 95
95 -
 96
96 -
 97
97 -
 98
98 -
 99
99 -
 100
100 -
 101
101 -
 102
102 -
 103
103 -
 104
104 -
 105
105 -
 106
106 -
 107
107 -
 108
108 -
 109
109 -
110
-
111
-
112
-
113
-
114
-
115
-
116
-
117
-
118
-
119
-
120
-
121
-
122
-
123
-
124
-
125
-
126
-
127
-
128
-
129
-
130
-
131
-
132
-
133
-
134
-
135
-
136
-
137
-
138
-
139
-
140
-
141
-
142
-
143
-
144
-
145
-
146
-
147
-
148
-
149
-
150
-
151
-
152
-
153
-
154
-
155
-
156
-
157
-
158
-
159
-
160
-
161
-
162
-
163
-
164
-
165
-
166
-
167
-
168
-
169
-
170
-
171
-
172
-
173
-
174
-
175
-
176
-
177
-
178
-
179
-
180
-
181
-
182
-
183
-
184
-
185
-
186
-
187
-
188
-
189
-
190
-
191
-
192
-
193
-
194
-
195
-
196
-
197
-
198
-
199
-
200
-
201
-
202
-
203
-
204
-
205
-
206
-
207
-
208
-
209
-
210
-
211
-
212
-
213
-
214
-
215
-
216
-
217
-
218
-
219
-
220
-
221
-
222
-
223
-
224
-
225
-
226
-
227
-
228
-
229
-
230
-
231
-
232
 |
 |

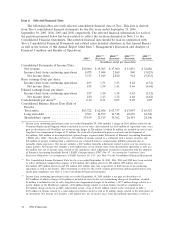
$21 million gain, net of income taxes, related to a cumulative effect adjustment recorded in conjunction with the change in
measurement date for pension and post retirement benefit plans (see Note 9 to the Consolidated Financial Statements).
(4) Income from continuing operations for the year ended September 30, 2004 includes a charge of $116 million related to
divestitures, net restructuring charges of $210 million, of which $6 million is included in cost of sales, charges for the
impairment of long-lived assets of $52 million, and a loss of $284 million related to the retirement of debt. Net income also
includes a $49 million loss, net of income taxes, from discontinued operations.
(5) In 2003, Tyco consolidated variable interest entities in accordance with the transition provisions of Financial Accounting
Standards Board (‘‘FASB’’) Interpretation (‘‘FIN’’) No. 46, ‘‘Consolidation of Variable Interest Entities.’’ As a result, Tyco
recorded a cumulative effect adjustment of $75 million, net of income taxes.
(6) Income from continuing operations for the year ended September 30, 2003 includes net restructuring credits of $68 million,
charges for the impairment of long-lived assets of $825 million, charges for the impairment of goodwill of $245 million,
additional changes in estimates $361 which arose from the Company’s intensified internal audits and detailed controls and
operating reviews, a charge of $91 million for a retroactive incremental premium on prior period directors and officers
insurance, a loss related to the retirement of debt of $128 million and a charge of $87 million related to the write-down of
certain investments. Net income also includes $156 million of income, net of income taxes, from discontinued operations.
(7) Loss from continuing operations for the year ended September 30, 2002 includes net restructuring and other charges of
$1,791 million, of which $732 million is included in cost of sales, charges of $3,307 million for the impairment of long-lived
assets, goodwill impairment charges of $1,344 million, and a charge for the write-off of purchased research and development
of $18 million. In addition, loss from continuing operations for the year ended September 30, 2002 includes a loss on
investments of $271 million, a net gain on divestiture of $24 million and $30 million of income relating to the retirement of
debt. Net loss also includes a $6,210 million loss, net of income taxes, from discontinued operations.
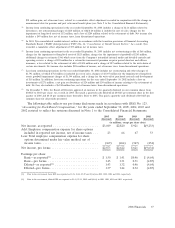
(8) On December 9, 2004, the Board of Directors approved an increase in the quarterly dividend on our common shares from
$0.0125 to $0.10 per share. As a result, in 2005, Tyco paid a quarterly cash dividend of $0.0125 per common share in the first
quarter of 2005 and $0.10 per common share thereafter. Prior to 2005, Tyco paid a quarterly cash dividend of $0.0125 per
common share for all periods presented.
The following table reflects our pro forma disclosures made in accordance with SFAS No. 123,
‘‘Accounting for Stock-Based Compensation,’’ for the years ended September 30, 2005, 2004, 2003 and
2002 restated to reflect the revisions discussed in Note 1 to the Consolidated Financial Statements.
2005 2004 2003 2002
(Restated) (Restated) (Restated) (Restated)
(in millions, except per share data)
Net income, as reported .......................... $3,019 $2,820 $ 921 $(9,233)
Add: Employee compensation expense for share options
included in reported net income, net of income taxes . . . 23 66 67 53
Less: Total employee compensation expense for share
options determined under fair value method, net of
income taxes ................................. (169) (264) (367) (454)
Net income, pro forma ........................... $2,873 $2,622 $ 621 $(9,634)
Earnings per share:
Basic—as reported(1) ........................... $ 1.50 $ 1.41 $0.46 $ (4.64)
Basic—pro forma ............................. 1.43 1.31 0.31 (4.85)
Diluted—as reported(2) ......................... 1.43 1.32 0.46 (4.64)
Diluted—pro forma ............................ 1.37 1.24 0.32 (4.85)
(1) Prior to the restatement, basic EPS was reported as $1.51, $1.44, $0.49 and $(4.62) in 2005, 2004, 2003 and 2002, respectively.
(2) Prior to the restatement, diluted EPS was reported as $1.43, $1.35, $0.49 and $(4.62) in 2005, 2004, 2003 and 2002, respectively.
2006 Financials 37