ADT 2006 Annual Report Download - page 219
Download and view the complete annual report
Please find page 219 of the 2006 ADT annual report below. You can navigate through the pages in the report by either clicking on the pages listed below, or by using the keyword search tool below to find specific information within the annual report.-
 1
1 -
2
-
3
-
4
-
5
-
6
-
7
-
8
-
9
-
10
-
11
-
12
-
13
-
14
-
15
-
16
-
17
-
18
-
19
-
20
-
21
-
22
-
23
-
24
-
25
-
26
-
27
-
28
-
29
-
30
-
31
-
32
-
33
-
34
-
35
-
36
-
37
-
38
-
39
-
40
-
41
-
42
-
43
-
44
-
45
-
46
-
47
-
48
-
49
-
50
-
51
-
52
-
53
-
54
-
55
-
56
-
57
-
58
-
59
-
60
-
61
-
62
-
63
-
64
-
65
-
66
-
67
-
68
-
69
-
70
-
71
-
72
-
73
-
74
-
75
-
76
-
77
-
78
-
79
-
80
-
81
-
82
-
83
-
84
-
85
-
86
-
87
-
88
-
89
-
90
-
91
-
92
-
93
-
94
-
95
-
96
-
97
-
98
-
99
-
100
-
101
-
102
-
103
-
104
-
105
-
106
-
107
-
108
-
109
-
110
-
111
-
112
-
113
-
114
-
115
-
116
-
117
-
118
-
119
-
120
-
121
-
122
-
123
-
124
-
125
-
126
-
127
-
128
-
129
-
130
-
131
-
132
-
133
-
134
-
135
-
136
-
137
-
138
-
139
-
140
-
141
-
142
-
143
-
144
-
145
-
146
-
147
-
148
-
149
-
150
-
151
-
152
-
153
-
154
-
155
-
156
-
157
-
158
-
159
-
160
-
161
-
162
-
163
-
164
-
165
-
166
-
167
-
168
-
169
-
170
-
171
-
172
-
173
-
174
-
175
-
176
-
177
-
178
-
179
-
180
-
181
-
182
-
183
-
184
-
185
-
186
-
187
-
188
-
189
-
190
-
191
-
192
-
193
-
194
-
195
-
196
-
197
-
198
-
199
-
200
-
201
-
202
-
203
-
204
-
205
-
206
-
207
-
208
-
 209
209 -
 210
210 -
 211
211 -
 212
212 -
 213
213 -
 214
214 -
 215
215 -
 216
216 -
 217
217 -
 218
218 -
 219
219 -
 220
220 -
 221
221 -
 222
222 -
 223
223 -
 224
224 -
 225
225 -
 226
226 -
 227
227 -
 228
228 -
 229
229 -
230
-
231
-
232
 |
 |

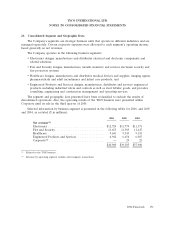
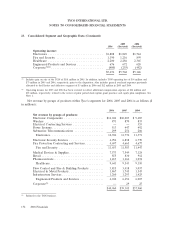
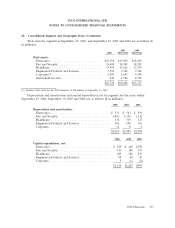
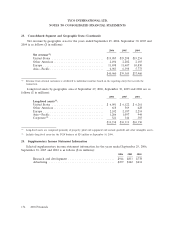
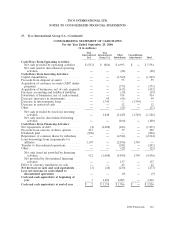
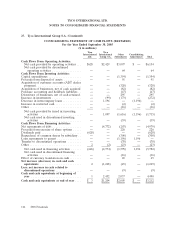
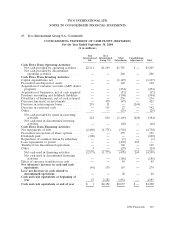
TYCO INTERNATIONAL LTD.
NOTES TO CONSOLIDATED FINANCIAL STATEMENTS
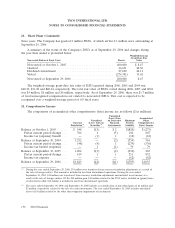
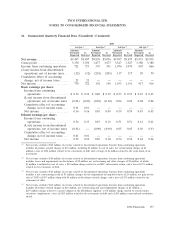
26. Summarized Quarterly Financial Data (Unaudited) (Continued)
2005
1st Qtr.(1) 2nd Qtr.(2) 3rd Qtr.(3) 4th Qtr.(4)
Amounts Amounts Amounts Amounts
Previously As Previously As Previously As Previously As
Reported Restated Reported Restated Reported Restated Reported Restated
Net revenue .................. $9,497 $9,497 $9,876 $9,876 $9,997 $9,997 $9,935 $9,935
Gross profit .................. 3,350 3,350 3,477 3,477 3,527 3,527 3,380 3,380
Income from continuing operations . 721 713 393 391 1,076 1,074 867 866
(Loss) income from discontinued
operations, net of income taxes . . (12) (12) (201) (201) 117 117 50 50
Cumulative effect of accounting
change, net of income taxes ..... 21 21——————
Net income .................. 730 722 192 190 1,193 1,191 917 916
Basic earnings per share:
Income from continuing
operations ................ $ 0.36 $ 0.36 $ 0.20 $ 0.19 $ 0.53 $ 0.53 $ 0.43 $ 0.43
(Loss) income from discontinued
operations, net of income taxes (0.01) (0.01) (0.10) (0.10) 0.06 0.06 0.02 0.02
Cumulative effect of accounting
change, net of income taxes . . . 0.01 0.01 ——————
Net income ................ 0.36 0.36 0.10 0.09 0.59 0.59 0.45 0.45
Diluted earnings per share:
Income from continuing
operations ................ 0.34 0.33 0.19 0.19 0.51 0.51 0.41 0.41
(Loss) income from discontinued
operations, net of income taxes (0.01) — (0.09) (0.09) 0.05 0.05 0.03 0.03
Cumulative effect of accounting
change, net of income taxes . . . 0.01 0.01 ——————
Net income ................ 0.34 0.34 0.10 0.10 0.56 0.56 0.44 0.44
(1) Net revenue excludes $568 million of revenue related to discontinued operations. Income from continuing operations
includes divestiture-related charges of $18 million, including $3 million in cost of sales, net restructuring charges of $6
million, a loss of $156 million related to the retirement of debt and a charge of $4 million related to the write-down of an
investment.
(2) Net revenue excludes $580 million of revenue related to discontinued operations. Income from continuing operations
includes losses and impairments on divestitures of $2 million, net restructuring and other charges of $5 million, of which
$1 million is included in cost of sales, a $50 million charge related to an SEC enforcement action, and a loss of $573 million
related to the retirement of debt.
(3) Net revenue excludes $565 million of revenue related to discontinued operations. Income from continuing operations
includes a net restructuring credit of $3 million, charges for the impairment of long-lived assets of $3 million, net gain on the
sale of TGN of $307 million along with $6 million of divestiture-related charges, and a loss of $179 million related to the
retirement of debt.
(4) Net revenue excludes $560 million of revenue related to discontinued operations. Income from continuing operations
includes divestiture-related charges of $10 million, net restructuring and asset impairment charges of $1 million, a
$277 million charge related to a patent dispute in the Healthcare segment, a $70 million charge related to certain former
executives’ employment, a loss of $105 million related to the retirement of debt and a $109 million court-ordered restitution
award.
2006 Financials 157