ADT 2006 Annual Report Download - page 98
Download and view the complete annual report
Please find page 98 of the 2006 ADT annual report below. You can navigate through the pages in the report by either clicking on the pages listed below, or by using the keyword search tool below to find specific information within the annual report.-
 1
1 -
2
-
3
-
4
-
5
-
6
-
7
-
8
-
9
-
10
-
11
-
12
-
13
-
14
-
15
-
16
-
17
-
18
-
19
-
20
-
21
-
22
-
23
-
24
-
25
-
26
-
27
-
28
-
29
-
30
-
31
-
32
-
33
-
34
-
35
-
36
-
37
-
38
-
39
-
40
-
41
-
42
-
43
-
44
-
45
-
46
-
47
-
48
-
49
-
50
-
51
-
52
-
53
-
54
-
55
-
56
-
57
-
58
-
59
-
60
-
61
-
62
-
63
-
64
-
65
-
66
-
67
-
68
-
69
-
70
-
71
-
72
-
73
-
74
-
75
-
76
-
77
-
78
-
79
-
80
-
81
-
82
-
83
-
84
-
85
-
86
-
87
-
 88
88 -
 89
89 -
 90
90 -
 91
91 -
 92
92 -
 93
93 -
 94
94 -
 95
95 -
 96
96 -
 97
97 -
 98
98 -
 99
99 -
 100
100 -
 101
101 -
 102
102 -
 103
103 -
 104
104 -
 105
105 -
 106
106 -
 107
107 -
 108
108 -
109
-
110
-
111
-
112
-
113
-
114
-
115
-
116
-
117
-
118
-
119
-
120
-
121
-
122
-
123
-
124
-
125
-
126
-
127
-
128
-
129
-
130
-
131
-
132
-
133
-
134
-
135
-
136
-
137
-
138
-
139
-
140
-
141
-
142
-
143
-
144
-
145
-
146
-
147
-
148
-
149
-
150
-
151
-
152
-
153
-
154
-
155
-
156
-
157
-
158
-
159
-
160
-
161
-
162
-
163
-
164
-
165
-
166
-
167
-
168
-
169
-
170
-
171
-
172
-
173
-
174
-
175
-
176
-
177
-
178
-
179
-
180
-
181
-
182
-
183
-
184
-
185
-
186
-
187
-
188
-
189
-
190
-
191
-
192
-
193
-
194
-
195
-
196
-
197
-
198
-
199
-
200
-
201
-
202
-
203
-
204
-
205
-
206
-
207
-
208
-
209
-
210
-
211
-
212
-
213
-
214
-
215
-
216
-
217
-
218
-
219
-
220
-
221
-
222
-
223
-
224
-
225
-
226
-
227
-
228
-
229
-
230
-
231
-
232
 |
 |

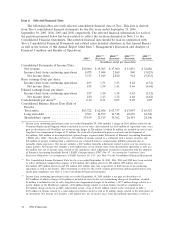
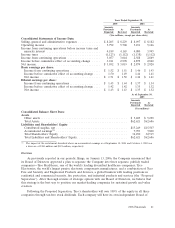
Item 6. Selected Financial Data
The following tables sets forth selected consolidated financial data of Tyco. This data is derived
from Tyco’s consolidated financial statements for the five years ended September 29, 2006,
September 30, 2005, 2004, 2003 and 2002, respectively. The selected financial information for each of
the periods presented below has been restated to reflect the revisions discussed in Note 1 to the
Consolidated Financial Statements. This selected financial data should be read in conjunction with
Tyco’s Consolidated Financial Statements and related notes included elsewhere in this Annual Report
as well as the section of this Annual Report titled Item 7. Management’s Discussion and Analysis of
Financial Condition and Results of Operations.
2005(2)(3) 2004(2)(4) 2003(2)(5)(6) 2002(2)(7)
2006(1) (Restated) (Restated) (Restated) (Restated)
(in millions, except per share data)
Consolidated Statements of Income Data:
Net revenue ...................... $40,960 $ 39,305 $ 37,960 $ 33,853 $ 32,686
Income (loss) from continuing operations . 4,075 3,044 2,869 840 (3,023)
Net income (loss) ................ 3,713 3,019 2,820 921 (9,233)
Basic earnings (loss) per share:
Income (loss) from continuing operations . 2.03 1.51 1.43 0.42 (1.52)
Net income (loss) ................ 1.85 1.50 1.41 0.46 (4.64)
Diluted earnings (loss) per share:
Income (loss) from continuing operations . 1.97 1.44 1.34 0.42 (1.52)
Net income (loss) ................ 1.80 1.43 1.32 0.46 (4.64)
Cash dividends per share(8) ............. 0.40 0.31 0.05 0.05 0.05
Consolidated Balance Sheets Data (End of
Period):
Total assets ....................... $63,722 $ 62,686 $ 63,737 $ 63,047 $ 65,525
Long-term debt .................... 9,365 10,599 14,518 18,059 16,506
Shareholders’ equity ................ 35,419 32,515 30,362 26,419 24,106
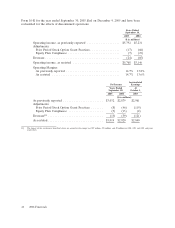
(1) Income from continuing operations for the year ended September 29, 2006 includes a charge of $100 million related to the
Voluntary Replacement Program, which is included in cost of sales. Also included are $169 million of separation costs, a net
gain on divestitures of $44 million, net restructuring charges of $26 million, of which $6 million are included in cost of sales,
long-lived asset impairment charges of $7 million, the write-off of purchased in-process research and development of
$63 million, $161 million of incremental stock option charges required under Statement of Financial Accounting Standards
(‘‘SFAS’’) No. 123R, ‘‘Share-Based Payment,’’ $72 million of income related to a settlement with a former executive and
$48 million of income resulting from a reduction in our estimated workers’ compensation liabilities primarily due to
favorable claims experience. Net income includes a $127 million favorable adjustment related to prior year tax reserves on
legacy matters. Net income also includes a $348 million loss, net of income taxes, from discontinued operations as well as a
$14 million loss, net of income taxes, related to the cumulative effect adjustment recorded in conjunction with the adoption
of Financial Accounting Standards Board (‘‘FASB’’) Interpretation (‘‘FIN’’) No. 47, ‘‘Accounting for Conditional Asset
Retirement Obligations—an Interpretation of FASB Statement No. 143’’ (see Note 9 to the Consolidated Financial Statements).
(2) The Consolidated Income Statement Data for the years ended September 30, 2005, 2004, 2003 and 2002 have been restated
to reflect additional compensation expense of $24 million ($13 million after-tax), $85 million ($59 million after-tax),
$84 million ($59 million after-tax) and $75 million ($53 million after-tax), respectively, in both income from continuing
operations as well as net income. This restatement is related to the review of prior period stock option grant practices and
equity plan compliance (see Note 1 to the Consolidated Financial Statements).
(3) Income from continuing operations for the year ended September 30, 2005 includes a net gain on divestitures of
$271 million, of which a charge of $3 million is included in cost of sales, net restructuring charges of $6 million, of which
$1 million is included in cost of sales, long-lived asset impairment charges of $6 million, a $277 million charge related to a
patent dispute in the Healthcare segment, a $70 million charge related to certain former executives’ employment, a
$50 million charge related to an SEC enforcement action, a loss of $1,013 million related to the retirement of debt, a
$109 million of income related to a court-ordered restitution award as well as $4 million charge related to the write-down of
an investment. Net income also includes a $46 million loss, net of income taxes, from discontinued operations as well as a
36 2006 Financials