ADT 2006 Annual Report Download - page 109
Download and view the complete annual report
Please find page 109 of the 2006 ADT annual report below. You can navigate through the pages in the report by either clicking on the pages listed below, or by using the keyword search tool below to find specific information within the annual report.-
 1
1 -
2
-
3
-
4
-
5
-
6
-
7
-
8
-
9
-
10
-
11
-
12
-
13
-
14
-
15
-
16
-
17
-
18
-
19
-
20
-
21
-
22
-
23
-
24
-
25
-
26
-
27
-
28
-
29
-
30
-
31
-
32
-
33
-
34
-
35
-
36
-
37
-
38
-
39
-
40
-
41
-
42
-
43
-
44
-
45
-
46
-
47
-
48
-
49
-
50
-
51
-
52
-
53
-
54
-
55
-
56
-
57
-
58
-
59
-
60
-
61
-
62
-
63
-
64
-
65
-
66
-
67
-
68
-
69
-
70
-
71
-
72
-
73
-
74
-
75
-
76
-
77
-
78
-
79
-
80
-
81
-
82
-
83
-
84
-
85
-
86
-
87
-
88
-
89
-
90
-
91
-
92
-
93
-
94
-
95
-
96
-
97
-
98
-
 99
99 -
 100
100 -
 101
101 -
 102
102 -
 103
103 -
 104
104 -
 105
105 -
 106
106 -
 107
107 -
 108
108 -
 109
109 -
 110
110 -
 111
111 -
 112
112 -
 113
113 -
 114
114 -
 115
115 -
 116
116 -
 117
117 -
 118
118 -
 119
119 -
120
-
121
-
122
-
123
-
124
-
125
-
126
-
127
-
128
-
129
-
130
-
131
-
132
-
133
-
134
-
135
-
136
-
137
-
138
-
139
-
140
-
141
-
142
-
143
-
144
-
145
-
146
-
147
-
148
-
149
-
150
-
151
-
152
-
153
-
154
-
155
-
156
-
157
-
158
-
159
-
160
-
161
-
162
-
163
-
164
-
165
-
166
-
167
-
168
-
169
-
170
-
171
-
172
-
173
-
174
-
175
-
176
-
177
-
178
-
179
-
180
-
181
-
182
-
183
-
184
-
185
-
186
-
187
-
188
-
189
-
190
-
191
-
192
-
193
-
194
-
195
-
196
-
197
-
198
-
199
-
200
-
201
-
202
-
203
-
204
-
205
-
206
-
207
-
208
-
209
-
210
-
211
-
212
-
213
-
214
-
215
-
216
-
217
-
218
-
219
-
220
-
221
-
222
-
223
-
224
-
225
-
226
-
227
-
228
-
229
-
230
-
231
-
232
 |
 |

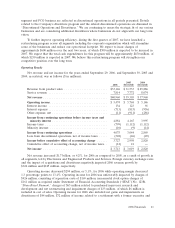
impact related to foreign currency exchange rates. Additionally, operating income for 2006 included a
gain on divestiture of $48 million, primarily relating to a sale of a business within Medical Devices and
Supplies.
Net revenue for Healthcare increased $433 million or 4.8% in 2005 as compared to 2004. This
increase resulted primarily from growth in existing businesses and, to a lesser extent, favorable changes
in foreign currency exchange rates of $141 million. Growth in Healthcare’s underlying businesses was
principally driven by increased revenue within Medical Devices & Supplies which was largely the result
of increased sales volume in the International division, primarily in Europe, due to a sales force
investment and sales growth in vessel sealing, laparoscopy, and stapling. Increased sales at the Surgical
division within Medical Devices & Supplies also strongly contributed, due to enhanced contracting with
group purchasing organizations, increased acceptance of Laparoscopic Gastric By-Pass procedures and
increased adoption of LigaSure device. Pharmaceuticals also contributed to the increase in revenue,
although to a lesser extent. These increases were partially offset by decreased sales in Retail primarily
due to a difficult competitive environment and customer consolidations.
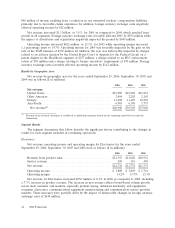
The decreases in operating income and operating margin in 2005 as compared to 2004 were due
primarily to a $277 million charge recorded in the fourth quarter of 2005, associated with the adverse
decision by the United States Court of Appeals for the Federal Circuit on a previously disclosed legal
matter. (Refer to Note 18 to the Consolidated Financial Statements for further discussion.) This
charge, combined with declines in the Retail division as a result of the competitive environment
mentioned above as well as increased material and transportation costs, was offset by substantial
increases from other divisions, specifically the International and Surgical divisions within Medical
Devices & Supplies as well as within Pharmaceutical. Increases in these divisions were due to strong
sales growth as mentioned above, combined with a favorable product mix. Also positively impacting the
segment were reduced administrative expenses at the segment level, as well as favorable foreign
exchange rates of $41 million.
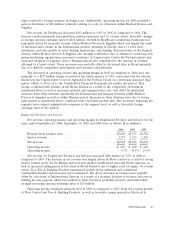
Engineered Products and Services
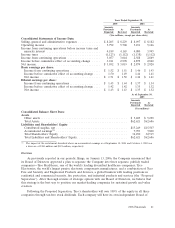
Net revenue, operating income and operating margin for Engineered Products and Services for the
years ended September 29, 2006, September 30, 2005 and 2004 were as follows ($ in millions):
2006 2005 2004
Revenue from product sales ............................. $5,625 $5,137 $4,582
Service revenue ...................................... 1,317 1,319 1,425
Net revenue ........................................ $6,942 $6,456 $6,007
Operating income .................................... $ 676 $ 672 $ 620
Operating margin ..................................... 9.7% 10.4% 10.3%
Net revenue for Engineered Products and Services increased $486 million or 7.5% in 2006 as
compared to 2005. The increase in net revenue was largely driven by Flow Control as a result of strong
project volume in the Pacific Region and favorable market conditions in Asia and North America, as
well as increased selling prices in Electrical & Metal Products due to higher costs of copper. To a lesser
extent, Tyco Fire & Building Products experienced growth in the industrial and commercial
construction markets and increased price realization. The above increases in revenue were partially
offset by a decrease at Infrastructure Services as a result of a strategic decision to be more selective in
bidding for new projects, which has resulted in fewer but more profitable projects, and unfavorable
changes in foreign currency exchange rates of $25 million.
Operating income remained relatively level in 2006 as compared to 2005. Both the revenue growth
at Flow Control and Fire & Building Products, as well as favorable copper spreads in Electrical &
2006 Financials 47