ADT 2006 Annual Report Download - page 214
Download and view the complete annual report
Please find page 214 of the 2006 ADT annual report below. You can navigate through the pages in the report by either clicking on the pages listed below, or by using the keyword search tool below to find specific information within the annual report.-
 1
1 -
2
-
3
-
4
-
5
-
6
-
7
-
8
-
9
-
10
-
11
-
12
-
13
-
14
-
15
-
16
-
17
-
18
-
19
-
20
-
21
-
22
-
23
-
24
-
25
-
26
-
27
-
28
-
29
-
30
-
31
-
32
-
33
-
34
-
35
-
36
-
37
-
38
-
39
-
40
-
41
-
42
-
43
-
44
-
45
-
46
-
47
-
48
-
49
-
50
-
51
-
52
-
53
-
54
-
55
-
56
-
57
-
58
-
59
-
60
-
61
-
62
-
63
-
64
-
65
-
66
-
67
-
68
-
69
-
70
-
71
-
72
-
73
-
74
-
75
-
76
-
77
-
78
-
79
-
80
-
81
-
82
-
83
-
84
-
85
-
86
-
87
-
88
-
89
-
90
-
91
-
92
-
93
-
94
-
95
-
96
-
97
-
98
-
99
-
100
-
101
-
102
-
103
-
104
-
105
-
106
-
107
-
108
-
109
-
110
-
111
-
112
-
113
-
114
-
115
-
116
-
117
-
118
-
119
-
120
-
121
-
122
-
123
-
124
-
125
-
126
-
127
-
128
-
129
-
130
-
131
-
132
-
133
-
134
-
135
-
136
-
137
-
138
-
139
-
140
-
141
-
142
-
143
-
144
-
145
-
146
-
147
-
148
-
149
-
150
-
151
-
152
-
153
-
154
-
155
-
156
-
157
-
158
-
159
-
160
-
161
-
162
-
163
-
164
-
165
-
166
-
167
-
168
-
169
-
170
-
171
-
172
-
173
-
174
-
175
-
176
-
177
-
178
-
179
-
180
-
181
-
182
-
183
-
184
-
185
-
186
-
187
-
188
-
189
-
190
-
191
-
192
-
193
-
194
-
195
-
196
-
197
-
198
-
199
-
200
-
201
-
202
-
203
-
 204
204 -
 205
205 -
 206
206 -
 207
207 -
 208
208 -
 209
209 -
 210
210 -
 211
211 -
 212
212 -
 213
213 -
 214
214 -
 215
215 -
 216
216 -
 217
217 -
 218
218 -
 219
219 -
 220
220 -
 221
221 -
 222
222 -
 223
223 -
 224
224 -
225
-
226
-
227
-
228
-
229
-
230
-
231
-
232
 |
 |

TYCO INTERNATIONAL LTD.
NOTES TO CONSOLIDATED FINANCIAL STATEMENTS
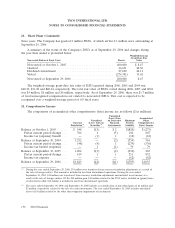
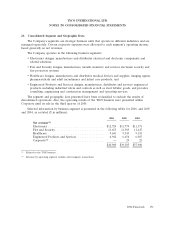
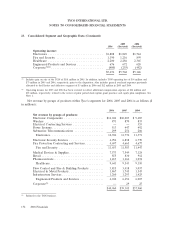
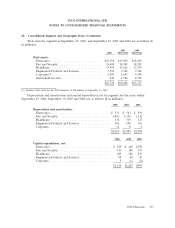
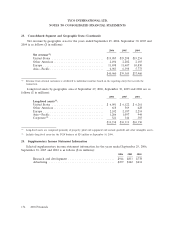
23. Consolidated Segment and Geographic Data (Continued)
2005 2004
2006 (Restated) (Restated)
Operating income:
Electronics ................................ $1,808 $1,849 $1,744
Fire and Security ........................... 1,190 1,216 899
Healthcare ................................ 2,200 2,286 2,365
Engineered Products and Services ............... 676 672 620
Corporate(1)(2) .............................. (400) (255) (482)
$5,474 $5,768 $5,146
(1) Includes gain on sale of the TGN of $301 million in 2005. In addition, includes TGN operating loss of $54 million and
$73 million in 2005 and 2004, respectively, prior to the disposition. Also includes general overhead expenses previously
allocated to the Plastics and Adhesives segment of $3 million in 2006 and $12 million in 2005 and 2004.
(2) Operating income for 2005 and 2004 has been restated to reflect additional compensation expense of $24 million and
$85 million, respectively, related to the review of prior period stock option grant practices and equity plan compliance. See
Note 1.
Net revenue by groups of products within Tyco’s segments for 2006, 2005 and 2004 is as follows ($
in millions):
2006 2005 2004
Net revenue by groups of products:
Electronic Components ....................... $11,041 $10,203 $ 9,485
Wireless .................................. 871 870 835
Electrical Contracting Services .................. — — 353
Power Systems .............................. 513 447 492
Submarine Telecommunications ................. 299 254 206
Electronics ............................... 12,724 11,774 11,371
Electronic Security Services .................... 6,956 6,838 6,770
Fire Protection Contracting and Services ........... 4,697 4,665 4,677
Fire and Security .......................... 11,653 11,503 11,447
Medical Devices & Supplies .................... 7,573 7,549 7,124
Retail .................................... 855 830 912
Pharmaceuticals ............................. 1,213 1,164 1,074
Healthcare ............................... 9,641 9,543 9,110
Flow Control and Fire & Building Products ........ 3,815 3,418 3,037
Electrical & Metal Products .................... 1,867 1,745 1,545
Infrastructure Services ........................ 1,260 1,293 1,425
Engineered Products and Services .............. 6,942 6,456 6,007
Corporate(1) ............................... — 29 25
$40,960 $39,305 $37,960
(1) Related to the TGN business.
152 2006 Financials