ADT 2006 Annual Report Download - page 127
Download and view the complete annual report
Please find page 127 of the 2006 ADT annual report below. You can navigate through the pages in the report by either clicking on the pages listed below, or by using the keyword search tool below to find specific information within the annual report.-
 1
1 -
2
-
3
-
4
-
5
-
6
-
7
-
8
-
9
-
10
-
11
-
12
-
13
-
14
-
15
-
16
-
17
-
18
-
19
-
20
-
21
-
22
-
23
-
24
-
25
-
26
-
27
-
28
-
29
-
30
-
31
-
32
-
33
-
34
-
35
-
36
-
37
-
38
-
39
-
40
-
41
-
42
-
43
-
44
-
45
-
46
-
47
-
48
-
49
-
50
-
51
-
52
-
53
-
54
-
55
-
56
-
57
-
58
-
59
-
60
-
61
-
62
-
63
-
64
-
65
-
66
-
67
-
68
-
69
-
70
-
71
-
72
-
73
-
74
-
75
-
76
-
77
-
78
-
79
-
80
-
81
-
82
-
83
-
84
-
85
-
86
-
87
-
88
-
89
-
90
-
91
-
92
-
93
-
94
-
95
-
96
-
97
-
98
-
99
-
100
-
101
-
102
-
103
-
104
-
105
-
106
-
107
-
108
-
109
-
110
-
111
-
112
-
113
-
114
-
115
-
116
-
 117
117 -
 118
118 -
 119
119 -
 120
120 -
 121
121 -
 122
122 -
 123
123 -
 124
124 -
 125
125 -
 126
126 -
 127
127 -
 128
128 -
 129
129 -
 130
130 -
 131
131 -
 132
132 -
 133
133 -
 134
134 -
 135
135 -
 136
136 -
 137
137 -
138
-
139
-
140
-
141
-
142
-
143
-
144
-
145
-
146
-
147
-
148
-
149
-
150
-
151
-
152
-
153
-
154
-
155
-
156
-
157
-
158
-
159
-
160
-
161
-
162
-
163
-
164
-
165
-
166
-
167
-
168
-
169
-
170
-
171
-
172
-
173
-
174
-
175
-
176
-
177
-
178
-
179
-
180
-
181
-
182
-
183
-
184
-
185
-
186
-
187
-
188
-
189
-
190
-
191
-
192
-
193
-
194
-
195
-
196
-
197
-
198
-
199
-
200
-
201
-
202
-
203
-
204
-
205
-
206
-
207
-
208
-
209
-
210
-
211
-
212
-
213
-
214
-
215
-
216
-
217
-
218
-
219
-
220
-
221
-
222
-
223
-
224
-
225
-
226
-
227
-
228
-
229
-
230
-
231
-
232
 |
 |

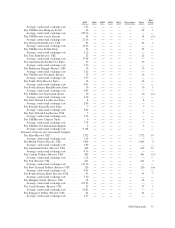
September 29, 2006 will be filled during 2007. Backlog by reportable industry segment at September 29,
2006 and September 30, 2005 is as follows ($ in millions):
2006 2005
Fire and Security ................................... $ 7,000 $ 6,732
Engineered Products and Services ....................... 4,167 4,007
Electronics ........................................ 2,711 2,496
Healthcare ........................................ 280 272
$14,158 $13,507
Within Fire and Security, backlog increased primarily as a result of strong bookings in North
America and Europe. Backlog for Fire and Security includes recurring revenue-in-force, which
represents twelve months’ fees for monitoring and maintenance services under contract in the security
business. The amount of recurring revenue-in-force at September 29, 2006 and September 30, 2005 was
$3.65 billion and $3.55 billion, respectively. Backlog within Engineered Products and Services increased
primarily as a result of increased orders at Flow Control. Within Electronics, backlog increased as a
result of increased bookings in most key end markets. Backlog in Healthcare represents unfilled orders,
which, in the nature of the business, are normally shipped shortly after purchase orders are received.
We do not view backlog in Healthcare to be a significant indicator of the level of future sales activity.
Off-Balance Sheet Arrangements
Sale of Accounts Receivable
Tyco utilized several programs under which it sold participating interests in accounts receivable to
investors who, in turn, purchased and received ownership and security interests in those receivables.
These transactions qualified as true sales. The sale proceeds were less than the face amount of
accounts receivable sold, and the discount from the face amount was included in selling, general and
administrative expenses in the Consolidated Statements of Income. Such discount aggregated
$18 million, or 3.1% of the weighted-average balance of the receivables outstanding, during 2004.
During 2004, the Company reduced outstanding balances under its accounts receivable programs
by $929 million, of which $812 million related to its corporate accounts receivable programs which were
terminated in 2005. No amounts were utilized under these programs at September 30, 2004, and
through the date of termination. The remaining reduction of $117 million related to certain of the
Company’s international businesses selling fewer accounts receivable as a short-term financing
mechanism. The aggregate amount outstanding under the Company’s remaining international accounts
receivable programs was $75 million and $80 million at September 29, 2006 and September 30, 2005,
respectively.
Guarantees
Certain of the Company’s business segments have guaranteed the performance of third-parties and
provided financial guarantees for uncompleted work and financial commitments. The terms of these
guarantees vary with end dates ranging from 2007 through the completion of such transactions. The
guarantees would be triggered in the event of nonperformance and the potential exposure for
nonperformance under the guarantees would not have a material effect on the Company’s financial
position, results of operations or cash flows.
In disposing of assets or businesses, the Company often provides representations, warranties and/or
indemnities to cover various risks including, for example, unknown damage to the assets, environmental
risks involved in the sale of real estate, liability to investigate and remediate environmental
2006 Financials 65