ADT 2006 Annual Report Download - page 2
Download and view the complete annual report
Please find page 2 of the 2006 ADT annual report below. You can navigate through the pages in the report by either clicking on the pages listed below, or by using the keyword search tool below to find specific information within the annual report.-
 1
1 -
 2
2 -
 3
3 -
 4
4 -
 5
5 -
 6
6 -
 7
7 -
 8
8 -
 9
9 -
 10
10 -
 11
11 -
 12
12 -
 13
13 -
14
-
15
-
16
-
17
-
18
-
19
-
20
-
21
-
22
-
23
-
24
-
25
-
26
-
27
-
28
-
29
-
30
-
31
-
32
-
33
-
34
-
35
-
36
-
37
-
38
-
39
-
40
-
41
-
42
-
43
-
44
-
45
-
46
-
47
-
48
-
49
-
50
-
51
-
52
-
53
-
54
-
55
-
56
-
57
-
58
-
59
-
60
-
61
-
62
-
63
-
64
-
65
-
66
-
67
-
68
-
69
-
70
-
71
-
72
-
73
-
74
-
75
-
76
-
77
-
78
-
79
-
80
-
81
-
82
-
83
-
84
-
85
-
86
-
87
-
88
-
89
-
90
-
91
-
92
-
93
-
94
-
95
-
96
-
97
-
98
-
99
-
100
-
101
-
102
-
103
-
104
-
105
-
106
-
107
-
108
-
109
-
110
-
111
-
112
-
113
-
114
-
115
-
116
-
117
-
118
-
119
-
120
-
121
-
122
-
123
-
124
-
125
-
126
-
127
-
128
-
129
-
130
-
131
-
132
-
133
-
134
-
135
-
136
-
137
-
138
-
139
-
140
-
141
-
142
-
143
-
144
-
145
-
146
-
147
-
148
-
149
-
150
-
151
-
152
-
153
-
154
-
155
-
156
-
157
-
158
-
159
-
160
-
161
-
162
-
163
-
164
-
165
-
166
-
167
-
168
-
169
-
170
-
171
-
172
-
173
-
174
-
175
-
176
-
177
-
178
-
179
-
180
-
181
-
182
-
183
-
184
-
185
-
186
-
187
-
188
-
189
-
190
-
191
-
192
-
193
-
194
-
195
-
196
-
197
-
198
-
199
-
200
-
201
-
202
-
203
-
204
-
205
-
206
-
207
-
208
-
209
-
210
-
211
-
212
-
213
-
214
-
215
-
216
-
217
-
218
-
219
-
220
-
221
-
222
-
223
-
224
-
225
-
226
-
227
-
228
-
229
-
230
-
231
-
232
 |
 |
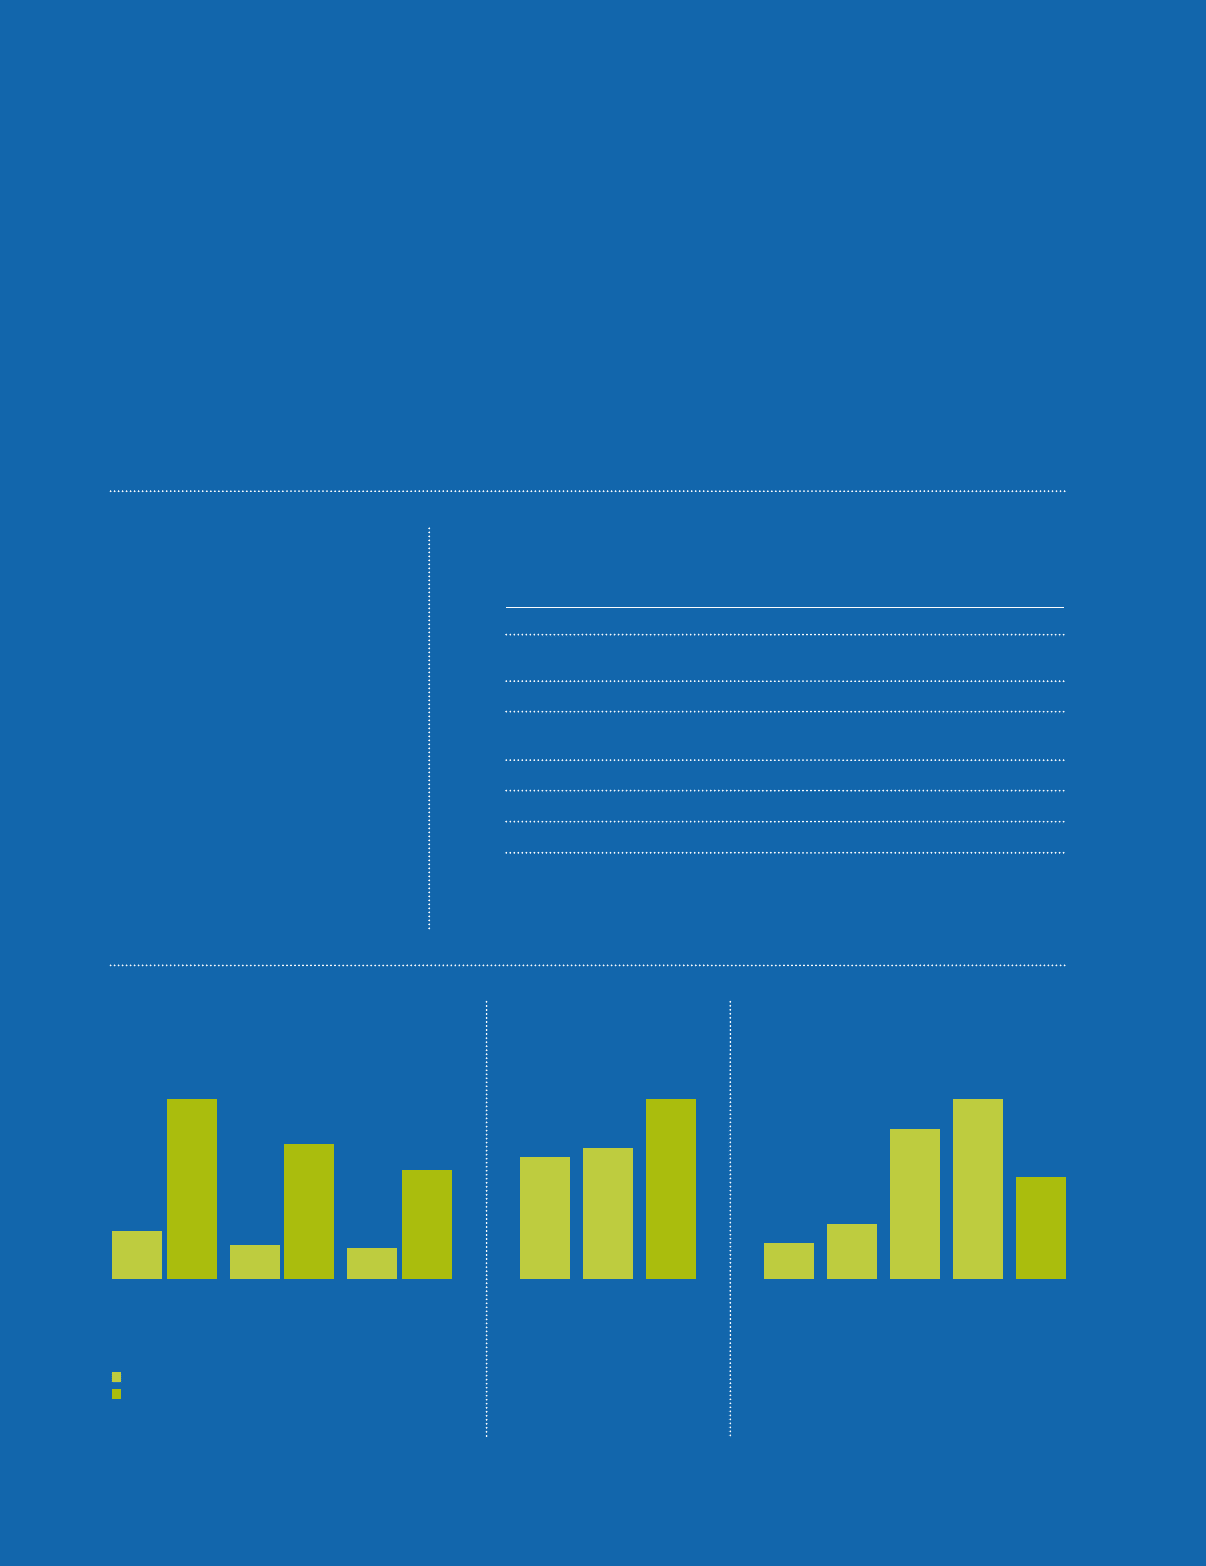
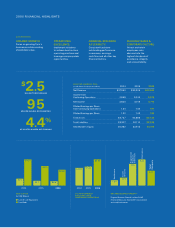
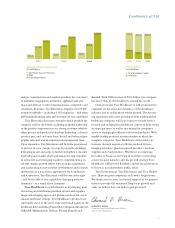
2006 FINANCIAL HIGHLIGHTS
ORGANIC GROWTH:
Focus on growing Tyco’s
businesses while creating
shareholder value.
OPERATIONAL
EXCELLENCE:
Implement initiatives
to achieve best-in-class
operating practices and
leverage company-wide
opportunities.
FINANCIAL STRENGTH
& FLEXIBILITY:
Consistently achieve
outstanding performance
in revenues, earnings,
cash flow and all other key
financial metrics.
BUILDING TEAMS &
CORPORATE CULTURE:
Attract and retain
employees who
demonstrate the
highest standards of
excellence, integrity
and accountability.
OUR PRIORITIES:
BILLION TO REPURCHASE
$2.5
DEBT & CASH
(In US$ Billions)
Cash & Cash Equivalents
Total Debt
$4.5
2004 2005 2006
$16.5
$3.2
$12.5
$2.9
$10.2
DILUTED EARNINGS
PER SHARE FROM
CONTINUING OPERATIONS
$1.34 $1.44
$1.97
2004 2005 2006
ORGANIC REVENUE GROWTH*
*Organic Revenue Growth is a Non-GAAP
Financial Measure. See GAAP reconciliation
on inside back cover.
1.9%
2.9%
7.9%
5.4%
9.3%
Fire &
Security
Healthcare
Engineered
Products
& Services
Total
Company
Electronics
SELECTED FINANCIAL DATA
(in US$ Millions Except per Share Data) 2004 2005 2006
Net Revenue $37,960 $39,305 $40,960
Income from
Continuing Operations 2,869 3,044 4,075
Net Income 2,820 3,019 3,713
Diluted Earnings per Share
from Continuing Operations 1.34 1.44 1.97
Diluted Earnings per Share 1.32 1.43 1.80
Total Assets 63,737 62,686 63,722
Total Liabilities 33,307 30,110 28,249
Shareholders’ Equity 30,362 32,515 35,419
MILLION SHARES, REPRESENTING
95
OF DILUTED SHARES OUTSTANDING
4.4%