ADT 2006 Annual Report Download - page 107
Download and view the complete annual report
Please find page 107 of the 2006 ADT annual report below. You can navigate through the pages in the report by either clicking on the pages listed below, or by using the keyword search tool below to find specific information within the annual report.-
 1
1 -
2
-
3
-
4
-
5
-
6
-
7
-
8
-
9
-
10
-
11
-
12
-
13
-
14
-
15
-
16
-
17
-
18
-
19
-
20
-
21
-
22
-
23
-
24
-
25
-
26
-
27
-
28
-
29
-
30
-
31
-
32
-
33
-
34
-
35
-
36
-
37
-
38
-
39
-
40
-
41
-
42
-
43
-
44
-
45
-
46
-
47
-
48
-
49
-
50
-
51
-
52
-
53
-
54
-
55
-
56
-
57
-
58
-
59
-
60
-
61
-
62
-
63
-
64
-
65
-
66
-
67
-
68
-
69
-
70
-
71
-
72
-
73
-
74
-
75
-
76
-
77
-
78
-
79
-
80
-
81
-
82
-
83
-
84
-
85
-
86
-
87
-
88
-
89
-
90
-
91
-
92
-
93
-
94
-
95
-
96
-
 97
97 -
 98
98 -
 99
99 -
 100
100 -
 101
101 -
 102
102 -
 103
103 -
 104
104 -
 105
105 -
 106
106 -
 107
107 -
 108
108 -
 109
109 -
 110
110 -
 111
111 -
 112
112 -
 113
113 -
 114
114 -
 115
115 -
 116
116 -
 117
117 -
118
-
119
-
120
-
121
-
122
-
123
-
124
-
125
-
126
-
127
-
128
-
129
-
130
-
131
-
132
-
133
-
134
-
135
-
136
-
137
-
138
-
139
-
140
-
141
-
142
-
143
-
144
-
145
-
146
-
147
-
148
-
149
-
150
-
151
-
152
-
153
-
154
-
155
-
156
-
157
-
158
-
159
-
160
-
161
-
162
-
163
-
164
-
165
-
166
-
167
-
168
-
169
-
170
-
171
-
172
-
173
-
174
-
175
-
176
-
177
-
178
-
179
-
180
-
181
-
182
-
183
-
184
-
185
-
186
-
187
-
188
-
189
-
190
-
191
-
192
-
193
-
194
-
195
-
196
-
197
-
198
-
199
-
200
-
201
-
202
-
203
-
204
-
205
-
206
-
207
-
208
-
209
-
210
-
211
-
212
-
213
-
214
-
215
-
216
-
217
-
218
-
219
-
220
-
221
-
222
-
223
-
224
-
225
-
226
-
227
-
228
-
229
-
230
-
231
-
232
 |
 |

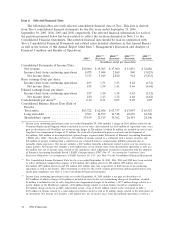
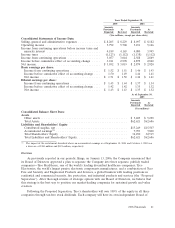
Operating income and operating margin for 2006 decreased as compared to 2005 due primarily to
increased material costs of $306 million, incremental stock option charges of $40 million required under
SFAS No. 123R and negative changes in foreign currency exchange rates of $23 million. Additionally,
operating income for 2006 included net restructuring, divestiture and impairment charges of
$16 million, of which $6 million is reflected in cost of sales, as compared to net restructuring and other
credits of $10 million in 2005, discussed below. Operating income for 2006 also includes $3 million
related to the Proposed Separation.
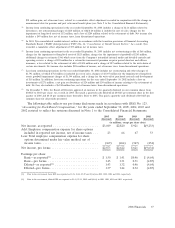
Net revenue for Electronics increased $403 million or 3.5% in 2005 as compared to 2004, including
a 6.4% increase in product revenue. The increase in net revenue was driven primarily by sales to the
automotive, aerospace and defense, consumer electronics, power utilities, communications equipment
manufacturing and communication service provider markets. In addition, revenue increased
substantially due to favorable changes in foreign currency exchange rates of $291 million. These
increases were partially offset by the impact of the divestiture of the Electrical Contracting Services
business of $353 million.
Operating income and operating margin for 2005 increased as compared to 2004 due primarily to
increased sales volume, cost savings initiatives and favorable changes in foreign currency exchange rates
of $57 million. These increases were partially offset by an 80 basis point impact of increased commodity
costs. Additionally, operating income for 2005 included net restructuring and other credits of
$10 million, as compared to net restructuring, divestiture and impairment charges of $20 million in
2004.
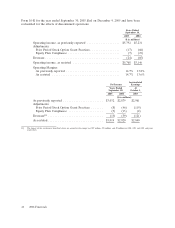
Fire and Security
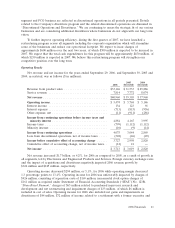
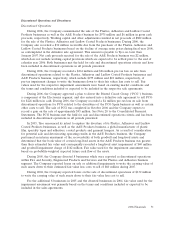
Net revenue, operating income and operating margin for Fire and Security for the years ended
September 29, 2006, September 30, 2005 and 2004 were as follows ($ in millions):
2006 2005 2004
Revenue from product sales .......................... $ 5,426 $ 5,299 $ 5,343
Service revenue ................................... 6,227 6,204 6,104
Net revenue ...................................... $11,653 $11,503 $11,447
Operating income .................................. $ 1,190 $ 1,216 $ 899
Operating margin .................................. 10.2% 10.6% 7.9%
Net revenue for Fire and Security increased $150 million or 1.3% in 2006 as compared to 2005,
including a 2.4% increase in product revenue. Revenue from product sales includes sales and
installation of security, fire protection and other systems. Net revenue increased due to growth in
Worldwide Fire Protection Contracting and Services primarily related to electrical and mechanical
contracting as well as growth in the North American and international markets in our Worldwide
Electronic Security Services. These increases were offset by the impact of acquisitions and divestitures
of $117 million, unfavorable changes in foreign currency exchange rates of $60 million, and a decrease
in sales of breathing and fire detection products within Safety Products.
Operating income decreased $26 million in 2006 over the prior year primarily as a result of lower
margins, increased investments in selling and marketing and a decline in European recurring
monitoring revenues within Worldwide Electronic Security Services. Results for the current period
included net restructuring, impairment and divestiture charges of $11 million as compared to net
restructuring, impairment and divestiture charges of $28 million in 2005. Operating income for 2006
was favorably impacted by cost savings related to operational excellence initiatives and prior year
restructuring programs. In addition, 2006 operating income was unfavorably impacted by $2 million
2006 Financials 45