ADT 2006 Annual Report Download - page 105
Download and view the complete annual report
Please find page 105 of the 2006 ADT annual report below. You can navigate through the pages in the report by either clicking on the pages listed below, or by using the keyword search tool below to find specific information within the annual report.-
 1
1 -
2
-
3
-
4
-
5
-
6
-
7
-
8
-
9
-
10
-
11
-
12
-
13
-
14
-
15
-
16
-
17
-
18
-
19
-
20
-
21
-
22
-
23
-
24
-
25
-
26
-
27
-
28
-
29
-
30
-
31
-
32
-
33
-
34
-
35
-
36
-
37
-
38
-
39
-
40
-
41
-
42
-
43
-
44
-
45
-
46
-
47
-
48
-
49
-
50
-
51
-
52
-
53
-
54
-
55
-
56
-
57
-
58
-
59
-
60
-
61
-
62
-
63
-
64
-
65
-
66
-
67
-
68
-
69
-
70
-
71
-
72
-
73
-
74
-
75
-
76
-
77
-
78
-
79
-
80
-
81
-
82
-
83
-
84
-
85
-
86
-
87
-
88
-
89
-
90
-
91
-
92
-
93
-
94
-
 95
95 -
 96
96 -
 97
97 -
 98
98 -
 99
99 -
 100
100 -
 101
101 -
 102
102 -
 103
103 -
 104
104 -
 105
105 -
 106
106 -
 107
107 -
 108
108 -
 109
109 -
 110
110 -
 111
111 -
 112
112 -
 113
113 -
 114
114 -
 115
115 -
116
-
117
-
118
-
119
-
120
-
121
-
122
-
123
-
124
-
125
-
126
-
127
-
128
-
129
-
130
-
131
-
132
-
133
-
134
-
135
-
136
-
137
-
138
-
139
-
140
-
141
-
142
-
143
-
144
-
145
-
146
-
147
-
148
-
149
-
150
-
151
-
152
-
153
-
154
-
155
-
156
-
157
-
158
-
159
-
160
-
161
-
162
-
163
-
164
-
165
-
166
-
167
-
168
-
169
-
170
-
171
-
172
-
173
-
174
-
175
-
176
-
177
-
178
-
179
-
180
-
181
-
182
-
183
-
184
-
185
-
186
-
187
-
188
-
189
-
190
-
191
-
192
-
193
-
194
-
195
-
196
-
197
-
198
-
199
-
200
-
201
-
202
-
203
-
204
-
205
-
206
-
207
-
208
-
209
-
210
-
211
-
212
-
213
-
214
-
215
-
216
-
217
-
218
-
219
-
220
-
221
-
222
-
223
-
224
-
225
-
226
-
227
-
228
-
229
-
230
-
231
-
232
 |
 |

segment and PCG business are reflected as discontinued operations in all periods presented. Details
related to the Company’s divestiture program and the related discontinued operations are discussed in
‘‘Discontinued Operations and Divestitures.’’ We are continuing to assess the strategic fit of our various
businesses and are considering additional divestitures where businesses do not align with our long term
vision.
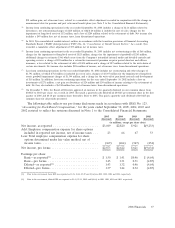
To further improve operating efficiency, during the first quarter of 2007, we have launched a
restructuring program across all segments including the corporate organization which will streamline
some of the businesses and reduce our operational footprint. We expect to incur charges of
approximately $600 million over the next two years, of which $500 million is expected to be incurred in
2007. We expect that the total cash expenditures for this program will be approximately $450 million, of
which $250 million is expected in 2007. We believe this restructuring program will strengthen our
competitive position over the long term.
Operating Results
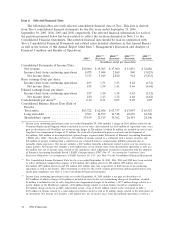
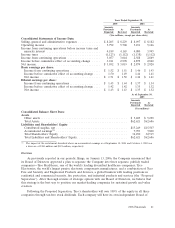
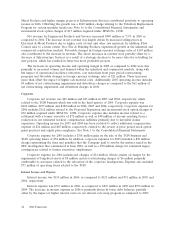
Net revenue and net income for the years ended September 29, 2006, and September 30, 2005 and
2004, as restated, was as follows ($ in millions):
2005 2004
2006 (Restated) (Restated)
Revenue from product sales ......................... $33,146 $ 31,533 $ 29,886
Service revenue .................................. 7,814 7,772 8,074
Net revenue ..................................... $40,960 $ 39,305 $ 37,960
Operating income ................................. $ 5,474 $ 5,768 $ 5,146
Interest income .................................. 134 123 91
Interest expense .................................. (713) (815) (956)
Other expense, net ................................ (11) (911) (286)
Income from continuing operations before income taxes and
minority interest ................................ 4,884 4,165 3,995
Income taxes .................................... (799) (1,112) (1,112)
Minority interest ................................. (10) (9) (14)
Income from continuing operations .................... 4,075 3,044 2,869
Loss from discontinued operations, net of income taxes ..... (348) (46) (49)
Income before cumulative effect of accounting change ...... 3,727 2,998 2,820
Cumulative effect of accounting change, net of income taxes . . (14) 21 —
Net income ..................................... $ 3,713 $ 3,019 $ 2,820
Net revenue increased $1.7 billion, or 4.2%, for 2006 as compared to 2005, as a result of growth in
all segments, led by Electronics and Engineered Products and Services. Foreign currency exchange rates
and the impact of acquisitions and divestitures negatively impacted 2006 revenue growth by
$326 million and $125 million, respectively.
Operating income decreased $294 million, or 5.1%, for 2006 while operating margin decreased
1.3 percentage points to 13.4%. Operating income for 2006 was unfavorably impacted by charges of
$426 million, consisting of separation costs of $169 million; incremental stock option charges of
$161 million as required under Statement of Financial Accounting Standards (‘‘SFAS’’) No. 123R,
‘‘Share-Based Payment,’’ charges of $63 million related to purchased in-process research and
development and net restructuring and impairment charges of $33 million, of which $6 million is
included in cost of sales. Operating income for 2006 also included net gains and impairments on
divestitures of $44 million, $72 million of income related to a settlement with a former executive and
2006 Financials 43