ADT 2006 Annual Report Download - page 216
Download and view the complete annual report
Please find page 216 of the 2006 ADT annual report below. You can navigate through the pages in the report by either clicking on the pages listed below, or by using the keyword search tool below to find specific information within the annual report.-
 1
1 -
2
-
3
-
4
-
5
-
6
-
7
-
8
-
9
-
10
-
11
-
12
-
13
-
14
-
15
-
16
-
17
-
18
-
19
-
20
-
21
-
22
-
23
-
24
-
25
-
26
-
27
-
28
-
29
-
30
-
31
-
32
-
33
-
34
-
35
-
36
-
37
-
38
-
39
-
40
-
41
-
42
-
43
-
44
-
45
-
46
-
47
-
48
-
49
-
50
-
51
-
52
-
53
-
54
-
55
-
56
-
57
-
58
-
59
-
60
-
61
-
62
-
63
-
64
-
65
-
66
-
67
-
68
-
69
-
70
-
71
-
72
-
73
-
74
-
75
-
76
-
77
-
78
-
79
-
80
-
81
-
82
-
83
-
84
-
85
-
86
-
87
-
88
-
89
-
90
-
91
-
92
-
93
-
94
-
95
-
96
-
97
-
98
-
99
-
100
-
101
-
102
-
103
-
104
-
105
-
106
-
107
-
108
-
109
-
110
-
111
-
112
-
113
-
114
-
115
-
116
-
117
-
118
-
119
-
120
-
121
-
122
-
123
-
124
-
125
-
126
-
127
-
128
-
129
-
130
-
131
-
132
-
133
-
134
-
135
-
136
-
137
-
138
-
139
-
140
-
141
-
142
-
143
-
144
-
145
-
146
-
147
-
148
-
149
-
150
-
151
-
152
-
153
-
154
-
155
-
156
-
157
-
158
-
159
-
160
-
161
-
162
-
163
-
164
-
165
-
166
-
167
-
168
-
169
-
170
-
171
-
172
-
173
-
174
-
175
-
176
-
177
-
178
-
179
-
180
-
181
-
182
-
183
-
184
-
185
-
186
-
187
-
188
-
189
-
190
-
191
-
192
-
193
-
194
-
195
-
196
-
197
-
198
-
199
-
200
-
201
-
202
-
203
-
204
-
205
-
 206
206 -
 207
207 -
 208
208 -
 209
209 -
 210
210 -
 211
211 -
 212
212 -
 213
213 -
 214
214 -
 215
215 -
 216
216 -
 217
217 -
 218
218 -
 219
219 -
 220
220 -
 221
221 -
 222
222 -
 223
223 -
 224
224 -
 225
225 -
 226
226 -
227
-
228
-
229
-
230
-
231
-
232
 |
 |

TYCO INTERNATIONAL LTD.
NOTES TO CONSOLIDATED FINANCIAL STATEMENTS
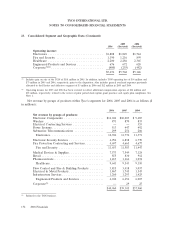
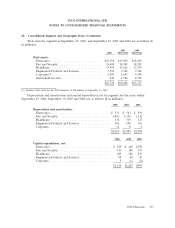
23. Consolidated Segment and Geographic Data (Continued)
Net revenue by geographic area for the years ended September 29, 2006, September 30, 2005 and
2004 is as follows ($ in millions):
2006 2005 2004
Net revenue(1):
United States .............................. $19,985 $19,298 $19,254
Other Americas ............................. 2,494 2,202 2,103
Europe ................................... 11,498 11,407 10,830
Asia—Pacific ............................... 6,983 6,398 5,773
$40,960 $39,305 $37,960
(1) Revenue from external customers is attributed to individual countries based on the reporting entity that records the
transaction.
Long-lived assets by geographic area at September 29, 2006, September 30, 2005 and 2004 are as
follows ($ in millions):
2006 2005 2004
Long-lived assets(1):
United States .............................. $ 6,091 $ 6,122 $ 6,261
Other Americas ............................. 618 569 628
Europe ................................... 2,242 2,187 2,214
Asia—Pacific ............................... 1,266 1,097 944
Corporate(2) ............................... 321 344 303
$10,538 $10,319 $10,350
(1) Long-lived assets are comprised primarily of property, plant and equipment and exclude goodwill and other intangible assets.
(2) Includes long-lived assets for the TGN business of $24 million at September 30, 2004.
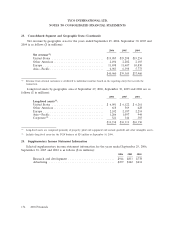
24. Supplementary Income Statement Information
Selected supplementary income statement information for the years ended September 29, 2006,
September 30, 2005 and 2004 is as follows ($ in millions):
2006 2005 2004
Research and development ........................... $914 $833 $778
Advertising ...................................... $239 $262 $234
154 2006 Financials