ADT 2006 Annual Report Download - page 110
Download and view the complete annual report
Please find page 110 of the 2006 ADT annual report below. You can navigate through the pages in the report by either clicking on the pages listed below, or by using the keyword search tool below to find specific information within the annual report.-
 1
1 -
2
-
3
-
4
-
5
-
6
-
7
-
8
-
9
-
10
-
11
-
12
-
13
-
14
-
15
-
16
-
17
-
18
-
19
-
20
-
21
-
22
-
23
-
24
-
25
-
26
-
27
-
28
-
29
-
30
-
31
-
32
-
33
-
34
-
35
-
36
-
37
-
38
-
39
-
40
-
41
-
42
-
43
-
44
-
45
-
46
-
47
-
48
-
49
-
50
-
51
-
52
-
53
-
54
-
55
-
56
-
57
-
58
-
59
-
60
-
61
-
62
-
63
-
64
-
65
-
66
-
67
-
68
-
69
-
70
-
71
-
72
-
73
-
74
-
75
-
76
-
77
-
78
-
79
-
80
-
81
-
82
-
83
-
84
-
85
-
86
-
87
-
88
-
89
-
90
-
91
-
92
-
93
-
94
-
95
-
96
-
97
-
98
-
99
-
 100
100 -
 101
101 -
 102
102 -
 103
103 -
 104
104 -
 105
105 -
 106
106 -
 107
107 -
 108
108 -
 109
109 -
 110
110 -
 111
111 -
 112
112 -
 113
113 -
 114
114 -
 115
115 -
 116
116 -
 117
117 -
 118
118 -
 119
119 -
 120
120 -
121
-
122
-
123
-
124
-
125
-
126
-
127
-
128
-
129
-
130
-
131
-
132
-
133
-
134
-
135
-
136
-
137
-
138
-
139
-
140
-
141
-
142
-
143
-
144
-
145
-
146
-
147
-
148
-
149
-
150
-
151
-
152
-
153
-
154
-
155
-
156
-
157
-
158
-
159
-
160
-
161
-
162
-
163
-
164
-
165
-
166
-
167
-
168
-
169
-
170
-
171
-
172
-
173
-
174
-
175
-
176
-
177
-
178
-
179
-
180
-
181
-
182
-
183
-
184
-
185
-
186
-
187
-
188
-
189
-
190
-
191
-
192
-
193
-
194
-
195
-
196
-
197
-
198
-
199
-
200
-
201
-
202
-
203
-
204
-
205
-
206
-
207
-
208
-
209
-
210
-
211
-
212
-
213
-
214
-
215
-
216
-
217
-
218
-
219
-
220
-
221
-
222
-
223
-
224
-
225
-
226
-
227
-
228
-
229
-
230
-
231
-
232
 |
 |
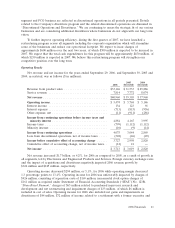
Metal Products and higher margin projects at Infrastructure Services contributed positively to operating
income in 2006. Offsetting this growth was a $100 million charge relating to the Voluntary Replacement
Program for certain sprinkler heads (see Note 16 to the Consolidated Financial Statements) and
incremental stock option charges of $17 million required under SFAS No. 123R.
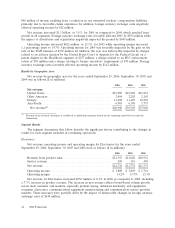
Net revenue for Engineered Products and Services increased $449 million or 7.5% in 2005 as
compared to 2004. The increase in net revenue was largely driven by increased selling prices in
Electrical & Metal Products due to higher costs of steel and other raw materials. In addition, Flow
Control and, to a lesser extent, Tyco Fire & Building Products experienced growth in the industrial and
commercial construction markets. Favorable changes in foreign currency exchange rates of $167 million
also contributed to the increase in revenue. The above increases in revenue were partially offset by a
decrease at Infrastructure Services as a result of a strategic decision to be more selective in bidding for
new projects, which has resulted in fewer but more profitable projects.
The increases in operating income and operating margin in 2005 as compared to 2004 were due
primarily to increased volume and demand within the industrial and commercial markets, along with
the impact of operational excellence initiatives, cost reductions from prior period restructuring
programs and favorable changes in foreign currency exchange rates of $21 million. These increases
more than offset the impact of higher raw material costs. Additionally, 2005 operating income includes
$4 million of net restructuring, impairment and divestiture charges as compared to the $62 million of
net restructuring, impairment and divestiture charges in 2004.
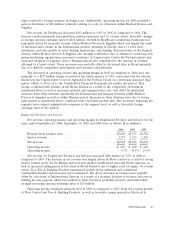
Corporate
Corporate net revenue was $29 million and $25 million in 2005 and 2004, respectively, which
related to the TGN business which was sold in the third quarter of 2005. Corporate expense was
$400 million, $255 million and $482 million in 2006, 2005 and 2004, respectively. Corporate expense for
2006 includes $162 million related to the Proposed Separation and incremental stock option charges of
$32 million required under SFAS No. 123R. Corporate expense also includes income related to a
settlement with a former executive of $72 million as well as $48 million of income resulting from a
reduction in our estimated workers’ compensation liabilities primarily due to favorable claims
experience. Operating income for 2005 and 2004 has been restated to reflect additional compensation
expense of $24 million and $85 million, respectively, related to the review of prior period stock option
grant practices and equity plan compliance. See Note 1 to the Consolidated Financial Statements.
Corporate expense for 2005 includes a $301 million gain on the sale of the TGN business and
TGN operating losses of $54 million. In addition, corporate expenses for 2005 included a $50 million
charge representing the fines and penalties that the Company paid to resolve the matters raised in the
SEC investigation that commenced in June 2002, as well as a $70 million charge for estimated legacy
contingencies related to former executives’ employment.
Corporate expense for 2004 includes net charges of $14 million, which consists of charges for the
impairment of long-lived assets of $8 million and net restructuring charges of $6 million primarily
attributable to severance related to the relocation of the corporate headquarters. Expense also included
$73 million of operating losses related to the TGN.
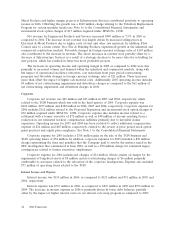
Interest Income and Expense
Interest income was $134 million in 2006, as compared to $123 million and $91 million in 2005 and
2004, respectively.
Interest expense was $713 million in 2006, as compared to $815 million in 2005 and $956 million in
2004. The decrease in interest expense in 2006 is primarily driven by lower debt balances, partially
offset by the impact of higher interest rates on our interest rate swap program as compared to 2005.
48 2006 Financials