ADT 2006 Annual Report Download - page 200
Download and view the complete annual report
Please find page 200 of the 2006 ADT annual report below. You can navigate through the pages in the report by either clicking on the pages listed below, or by using the keyword search tool below to find specific information within the annual report.-
 1
1 -
2
-
3
-
4
-
5
-
6
-
7
-
8
-
9
-
10
-
11
-
12
-
13
-
14
-
15
-
16
-
17
-
18
-
19
-
20
-
21
-
22
-
23
-
24
-
25
-
26
-
27
-
28
-
29
-
30
-
31
-
32
-
33
-
34
-
35
-
36
-
37
-
38
-
39
-
40
-
41
-
42
-
43
-
44
-
45
-
46
-
47
-
48
-
49
-
50
-
51
-
52
-
53
-
54
-
55
-
56
-
57
-
58
-
59
-
60
-
61
-
62
-
63
-
64
-
65
-
66
-
67
-
68
-
69
-
70
-
71
-
72
-
73
-
74
-
75
-
76
-
77
-
78
-
79
-
80
-
81
-
82
-
83
-
84
-
85
-
86
-
87
-
88
-
89
-
90
-
91
-
92
-
93
-
94
-
95
-
96
-
97
-
98
-
99
-
100
-
101
-
102
-
103
-
104
-
105
-
106
-
107
-
108
-
109
-
110
-
111
-
112
-
113
-
114
-
115
-
116
-
117
-
118
-
119
-
120
-
121
-
122
-
123
-
124
-
125
-
126
-
127
-
128
-
129
-
130
-
131
-
132
-
133
-
134
-
135
-
136
-
137
-
138
-
139
-
140
-
141
-
142
-
143
-
144
-
145
-
146
-
147
-
148
-
149
-
150
-
151
-
152
-
153
-
154
-
155
-
156
-
157
-
158
-
159
-
160
-
161
-
162
-
163
-
164
-
165
-
166
-
167
-
168
-
169
-
170
-
171
-
172
-
173
-
174
-
175
-
176
-
177
-
178
-
179
-
180
-
181
-
182
-
183
-
184
-
185
-
186
-
187
-
188
-
189
-
 190
190 -
 191
191 -
 192
192 -
 193
193 -
 194
194 -
 195
195 -
 196
196 -
 197
197 -
 198
198 -
 199
199 -
 200
200 -
 201
201 -
 202
202 -
 203
203 -
 204
204 -
 205
205 -
 206
206 -
 207
207 -
 208
208 -
 209
209 -
 210
210 -
211
-
212
-
213
-
214
-
215
-
216
-
217
-
218
-
219
-
220
-
221
-
222
-
223
-
224
-
225
-
226
-
227
-
228
-
229
-
230
-
231
-
232
 |
 |

TYCO INTERNATIONAL LTD.
NOTES TO CONSOLIDATED FINANCIAL STATEMENTS
18. Commitments and Contingencies (Continued)
The Company is a defendant in a number of other pending legal proceedings incidental to present
and former operations, acquisitions and dispositions. The Company does not expect the outcome of
these proceedings, either individually or in the aggregate, to have a material adverse effect on its
financial position, results of operations or cash flows.
19. Retirement Plans
Measurement Date—In 2005, the Company changed the measurement date for its pension and post
retirement benefit plans from September 30th to August 31st, effective October 1, 2004. The Company
believes that the one-month change of measurement date is a preferable change as it allows
management adequate time to evaluate and report the actuarial information in the Company’s
Consolidated Financial Statements under the accelerated reporting deadlines. Accordingly, all amounts
presented as of and for the years ended September 29, 2006 and September 30, 2005 reflect an
August 31 measurement date, while prior years reflect a September 30 measurement date. The
Company has accounted for the change in measurement date as a change in accounting principle. The
cumulative effect of the accounting principle change as of the beginning of 2005 was a $21 million
after-tax gain ($28 million pretax). The effects of this change in measurement date did not have a
material effect on net periodic benefit costs.
Defined Benefit Pension Plans—The Company has a number of noncontributory and contributory
defined benefit retirement plans covering certain of its U.S. and non-U.S. employees, designed in
accordance with conditions and practices in the countries concerned. Net periodic pension benefit cost
is based on periodic actuarial valuations which use the projected unit credit method of calculation and
is charged to the Consolidated Statements of Income on a systematic basis over the expected average
remaining service lives of current participants. Contribution amounts are determined based on the
advice of professionally qualified actuaries in the countries concerned. The benefits under the defined
benefit plans are based on various factors, such as years of service and compensation. The following
tables exclude amounts related to discontinued operations for all periods presented.
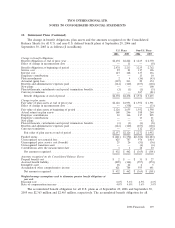
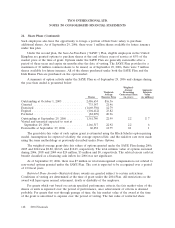
The net periodic benefit cost for all U.S. and non-U.S. defined benefit pension plans for 2006,
2005 and 2004 is as follows ($ in millions):
U.S. Plans Non-U.S. Plans
2006 2005 2004 2006 2005 2004
Service cost ....................................... $ 25 $ 21 $ 25 $117 $106 $102
Interest cost ...................................... 127 128 129 137 136 123
Expected return on plan assets ......................... (164) (151) (114) (126) (107) (86)
Amortization of initial net asset obligation ................ — — (1) — — —
Amortization of prior service cost (benefit) ................333(4)(1)1
Amortization of net actuarial loss ....................... 52 43 46 54 47 52
Plan settlements, curtailments and special termination benefits . . (1) 1 3 1 (4) 5
Net periodic benefit cost ............................ $ 42 $ 45 $ 91 $179 $177 $197
Weighted-average assumptions used to determine net pension cost
during the period:
Discount rate ..................................... 5.3% 6.0% 6.0% 4.3% 4.9% 4.9%
Expected return on plan assets ......................... 8.0% 8.0% 8.0% 6.3% 6.5% 6.3%
Rate of compensation increase ......................... 4.0% 4.3% 4.3% 3.4% 3.6% 3.4%
138 2006 Financials