ADT 2006 Annual Report Download - page 226
Download and view the complete annual report
Please find page 226 of the 2006 ADT annual report below. You can navigate through the pages in the report by either clicking on the pages listed below, or by using the keyword search tool below to find specific information within the annual report.-
 1
1 -
2
-
3
-
4
-
5
-
6
-
7
-
8
-
9
-
10
-
11
-
12
-
13
-
14
-
15
-
16
-
17
-
18
-
19
-
20
-
21
-
22
-
23
-
24
-
25
-
26
-
27
-
28
-
29
-
30
-
31
-
32
-
33
-
34
-
35
-
36
-
37
-
38
-
39
-
40
-
41
-
42
-
43
-
44
-
45
-
46
-
47
-
48
-
49
-
50
-
51
-
52
-
53
-
54
-
55
-
56
-
57
-
58
-
59
-
60
-
61
-
62
-
63
-
64
-
65
-
66
-
67
-
68
-
69
-
70
-
71
-
72
-
73
-
74
-
75
-
76
-
77
-
78
-
79
-
80
-
81
-
82
-
83
-
84
-
85
-
86
-
87
-
88
-
89
-
90
-
91
-
92
-
93
-
94
-
95
-
96
-
97
-
98
-
99
-
100
-
101
-
102
-
103
-
104
-
105
-
106
-
107
-
108
-
109
-
110
-
111
-
112
-
113
-
114
-
115
-
116
-
117
-
118
-
119
-
120
-
121
-
122
-
123
-
124
-
125
-
126
-
127
-
128
-
129
-
130
-
131
-
132
-
133
-
134
-
135
-
136
-
137
-
138
-
139
-
140
-
141
-
142
-
143
-
144
-
145
-
146
-
147
-
148
-
149
-
150
-
151
-
152
-
153
-
154
-
155
-
156
-
157
-
158
-
159
-
160
-
161
-
162
-
163
-
164
-
165
-
166
-
167
-
168
-
169
-
170
-
171
-
172
-
173
-
174
-
175
-
176
-
177
-
178
-
179
-
180
-
181
-
182
-
183
-
184
-
185
-
186
-
187
-
188
-
189
-
190
-
191
-
192
-
193
-
194
-
195
-
196
-
197
-
198
-
199
-
200
-
201
-
202
-
203
-
204
-
205
-
206
-
207
-
208
-
209
-
210
-
211
-
212
-
213
-
214
-
215
-
 216
216 -
 217
217 -
 218
218 -
 219
219 -
 220
220 -
 221
221 -
 222
222 -
 223
223 -
 224
224 -
 225
225 -
 226
226 -
 227
227 -
 228
228 -
 229
229 -
 230
230 -
 231
231 -
 232
232
 |
 |

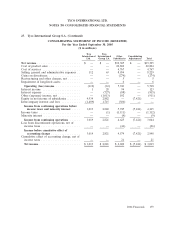
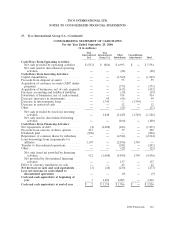
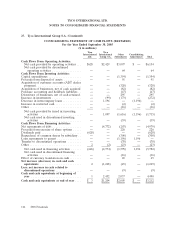
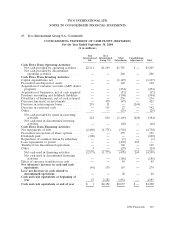
TYCO INTERNATIONAL LTD.
NOTES TO CONSOLIDATED FINANCIAL STATEMENTS
27. Tyco International Group S.A. (Continued)
CONSOLIDATING STATEMENT OF CASH FLOWS (RESTATED)
For the Year Ended September 30, 2005
($ in millions)
Tyco Tyco
International International Other Consolidating
Ltd. Group S.A. Subsidiaries Adjustments Total
Cash Flows From Operating Activities:
Net cash provided by operating activities . . . $628 $2,429 $3,097 $ — $6,154
Net cash provided by discontinued
operating activities ................. — — 64 — 64
Cash Flows From Investing Activities:
Capital expenditures ................... — — (1,354) — (1,354)
Proceeds from disposal of assets .......... — — 91 — 91
Acquisition of customer accounts (ADT dealer
program) .......................... — — (328) — (328)
Acquisition of businesses, net of cash acquired — — (82) — (82)
Purchase accounting and holdback liabilities . . — — (47) — (47)
Divestiture of businesses, net of cash retained . — — 295 — 295
Increase in investments ................. — (99) (173) — (272)
Decrease in intercompany loans ........... — 1,196 — (1,196) —
Increase in restricted cash ............... — — (2) — (2)
Other .............................. — — (16) — (16)
Net cash provided by (used in) investing
activities ........................ — 1,097 (1,616) (1,196) (1,715)
Net cash used in discontinued investing
activities ........................ — — (39) — (39)
Cash Flows From Financing Activities:
Net repayments of debt ................. — (4,772) (207) — (4,979)
Proceeds from exercise of share options ..... — — 226 — 226
Dividends paid ....................... (628) — — — (628)
Repurchase of common shares by subsidiary . . — — (300) — (300)
Loan repayments to parent .............. — — (1,196) 1,196 —
Transfer to discontinued operations ........ — — (78) — (78)
Other .............................. 2 (2) (23) — (23)
Net cash used in financing activities ...... (626) (4,774) (1,578) 1,196 (5,782)
Net cash used in discontinued financing
activities ........................ — — (16) — (16)
Effect of currency translation on cash ....... — — 65 — 65
Net increase (decrease) in cash and cash
equivalents ........................ 2 (1,248) (23) — (1,269)
Less: net increase in cash related to
discontinued operations ............... — — (9) — (9)
Cash and cash equivalents at beginning of
year ............................. 1 2,452 2,037 — 4,490
Cash and cash equivalents at end of year .... $ 3 $1,204 $2,005 $ — $3,212
164 2006 Financials