ADT 2006 Annual Report Download - page 202
Download and view the complete annual report
Please find page 202 of the 2006 ADT annual report below. You can navigate through the pages in the report by either clicking on the pages listed below, or by using the keyword search tool below to find specific information within the annual report.-
 1
1 -
2
-
3
-
4
-
5
-
6
-
7
-
8
-
9
-
10
-
11
-
12
-
13
-
14
-
15
-
16
-
17
-
18
-
19
-
20
-
21
-
22
-
23
-
24
-
25
-
26
-
27
-
28
-
29
-
30
-
31
-
32
-
33
-
34
-
35
-
36
-
37
-
38
-
39
-
40
-
41
-
42
-
43
-
44
-
45
-
46
-
47
-
48
-
49
-
50
-
51
-
52
-
53
-
54
-
55
-
56
-
57
-
58
-
59
-
60
-
61
-
62
-
63
-
64
-
65
-
66
-
67
-
68
-
69
-
70
-
71
-
72
-
73
-
74
-
75
-
76
-
77
-
78
-
79
-
80
-
81
-
82
-
83
-
84
-
85
-
86
-
87
-
88
-
89
-
90
-
91
-
92
-
93
-
94
-
95
-
96
-
97
-
98
-
99
-
100
-
101
-
102
-
103
-
104
-
105
-
106
-
107
-
108
-
109
-
110
-
111
-
112
-
113
-
114
-
115
-
116
-
117
-
118
-
119
-
120
-
121
-
122
-
123
-
124
-
125
-
126
-
127
-
128
-
129
-
130
-
131
-
132
-
133
-
134
-
135
-
136
-
137
-
138
-
139
-
140
-
141
-
142
-
143
-
144
-
145
-
146
-
147
-
148
-
149
-
150
-
151
-
152
-
153
-
154
-
155
-
156
-
157
-
158
-
159
-
160
-
161
-
162
-
163
-
164
-
165
-
166
-
167
-
168
-
169
-
170
-
171
-
172
-
173
-
174
-
175
-
176
-
177
-
178
-
179
-
180
-
181
-
182
-
183
-
184
-
185
-
186
-
187
-
188
-
189
-
190
-
191
-
 192
192 -
 193
193 -
 194
194 -
 195
195 -
 196
196 -
 197
197 -
 198
198 -
 199
199 -
 200
200 -
 201
201 -
 202
202 -
 203
203 -
 204
204 -
 205
205 -
 206
206 -
 207
207 -
 208
208 -
 209
209 -
 210
210 -
 211
211 -
 212
212 -
213
-
214
-
215
-
216
-
217
-
218
-
219
-
220
-
221
-
222
-
223
-
224
-
225
-
226
-
227
-
228
-
229
-
230
-
231
-
232
 |
 |

TYCO INTERNATIONAL LTD.
NOTES TO CONSOLIDATED FINANCIAL STATEMENTS
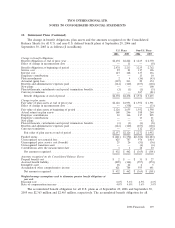
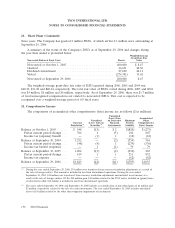
19. Retirement Plans (Continued)
non-U.S. plans as of September 29, 2006 and September 30, 2005 was $3,192 million and
$2,870 million, respectively.
The accumulated benefit obligation and fair value of plan assets for U.S. pension plans with
accumulated benefit obligations in excess of plan assets were $2,355 million and $2,149 million,
respectively, at September 29, 2006 and $2,465 million and $2,126 million, respectively, at
September 30, 2005.
The accumulated benefit obligation and fair value of plan assets for non-U.S. pension plans with
accumulated benefit obligations in excess of plan assets were $3,051 million and $2,097 million,
respectively, at September 29, 2006 and $2,738 million and $1,796 million, respectively, at
September 30, 2005.
In determining the expected return on plan assets, the Company considers the relative weighting of
plan assets by class and individual asset class performance expectations as provided by its external
advisors.
The Company’s investment strategy for its pension plans is to manage the plans on a going-
concern basis. Current investment policy is to achieve a superior return on assets, subject to a prudent
level of portfolio risk, for the purpose of enhancing the security of benefits for participants. For U.S.
pension plans, this policy targets a 60% allocation to equity securities and a 40% allocation to debt
securities. Various asset allocation strategies are in place for non-U.S. pension plans, with a weighted-
average target allocation of 54% to equity securities, 40% to debt securities and 6% to other asset
classes, including real estate and cash equivalents.
Pension plans have the following weighted-average asset allocations at September 29, 2006 and
September 30, 2005:
U.S. Plans Non-U.S. Plans
2006 2005 2006 2005
Asset Category:
Equity securities ............................ 60% 59% 54% 54%
Debt securities ............................. 40% 38% 38% 31%
Real estate ............................... — — 3% 3%
Cash and cash equivalents .................... — 3% 5% 12%
Total .................................. 100% 100% 100% 100%
Although the Company does not buy or sell any of its own stock as a direct investment for its
pension funds, due to external investment management of the funds, the plans may indirectly hold Tyco
stock. The aggregate amount of the shares would not be considered material relative to the total fund
assets.
The Company’s funding policy is to make contributions in accordance with the laws and customs of
the various countries in which it operates as well as to make discretionary voluntary contributions from
time-to-time. The Company anticipates that at a minimum it will make the minimum required
contributions to its pension plans in 2007 of $10 million for the U.S. plans and $141 million for
non-U.S. plans.
140 2006 Financials