ADT 2006 Annual Report Download - page 108
Download and view the complete annual report
Please find page 108 of the 2006 ADT annual report below. You can navigate through the pages in the report by either clicking on the pages listed below, or by using the keyword search tool below to find specific information within the annual report.-
 1
1 -
2
-
3
-
4
-
5
-
6
-
7
-
8
-
9
-
10
-
11
-
12
-
13
-
14
-
15
-
16
-
17
-
18
-
19
-
20
-
21
-
22
-
23
-
24
-
25
-
26
-
27
-
28
-
29
-
30
-
31
-
32
-
33
-
34
-
35
-
36
-
37
-
38
-
39
-
40
-
41
-
42
-
43
-
44
-
45
-
46
-
47
-
48
-
49
-
50
-
51
-
52
-
53
-
54
-
55
-
56
-
57
-
58
-
59
-
60
-
61
-
62
-
63
-
64
-
65
-
66
-
67
-
68
-
69
-
70
-
71
-
72
-
73
-
74
-
75
-
76
-
77
-
78
-
79
-
80
-
81
-
82
-
83
-
84
-
85
-
86
-
87
-
88
-
89
-
90
-
91
-
92
-
93
-
94
-
95
-
96
-
97
-
 98
98 -
 99
99 -
 100
100 -
 101
101 -
 102
102 -
 103
103 -
 104
104 -
 105
105 -
 106
106 -
 107
107 -
 108
108 -
 109
109 -
 110
110 -
 111
111 -
 112
112 -
 113
113 -
 114
114 -
 115
115 -
 116
116 -
 117
117 -
 118
118 -
119
-
120
-
121
-
122
-
123
-
124
-
125
-
126
-
127
-
128
-
129
-
130
-
131
-
132
-
133
-
134
-
135
-
136
-
137
-
138
-
139
-
140
-
141
-
142
-
143
-
144
-
145
-
146
-
147
-
148
-
149
-
150
-
151
-
152
-
153
-
154
-
155
-
156
-
157
-
158
-
159
-
160
-
161
-
162
-
163
-
164
-
165
-
166
-
167
-
168
-
169
-
170
-
171
-
172
-
173
-
174
-
175
-
176
-
177
-
178
-
179
-
180
-
181
-
182
-
183
-
184
-
185
-
186
-
187
-
188
-
189
-
190
-
191
-
192
-
193
-
194
-
195
-
196
-
197
-
198
-
199
-
200
-
201
-
202
-
203
-
204
-
205
-
206
-
207
-
208
-
209
-
210
-
211
-
212
-
213
-
214
-
215
-
216
-
217
-
218
-
219
-
220
-
221
-
222
-
223
-
224
-
225
-
226
-
227
-
228
-
229
-
230
-
231
-
232
 |
 |

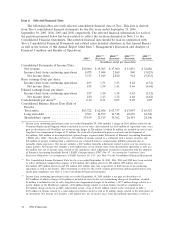
related to the Proposed Separation as well as incremental stock option charges of $35 million required
under SFAS No. 123R.
Attrition rates for customers in our Worldwide Electronic Security Services business decreased to
13.8% on a trailing twelve-month basis for 2006, as compared to 14.8% for 2005 and 15.1% in 2004.
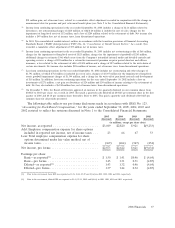
Net revenue for Fire and Security remained relatively level during 2005 as compared to 2004 as
the decrease in product revenue was offset by an increase in service revenue. Revenue from product
sales includes sales and installation of security, fire protection and other systems. Net revenue increased
due to favorable changes in foreign currency exchange rates of $274 million and, to a lesser extent,
increased sales volume of breathing and intrusion products at Tyco Safety Products as well as growth in
our European fire services business. These increases were offset by the impact of divestitures of
$315 million and decreased sales at our security business in Europe.
Operating income increased $317 million in 2005 over the prior year. Results for the current
period included net restructuring, impairment and divestiture charges of $28 million as compared to net
restructuring, impairment and divestiture charges of $264 million in 2004. Operating income for 2005
was also favorably impacted by foreign currency exchange rates of $26 million as well as cost savings
related to operational excellence initiatives and prior year restructuring programs. These cost
reductions were partially offset by increased investment in sales and marketing.
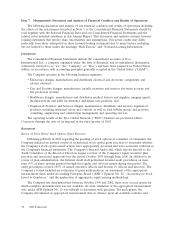
Healthcare
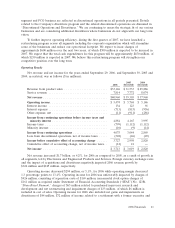
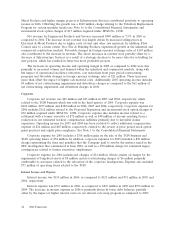
Net revenue, operating income and operating margin for Healthcare for the years ended
September 29, 2006, September 30, 2005 and 2004 were as follows ($ in millions):
2006 2005 2004
Revenue from product sales ............................. $9,579 $9,477 $9,040
Service revenue ...................................... 62 66 70
Net revenue ........................................ $9,641 $9,543 $9,110
Operating income .................................... $2,200 $2,286 $2,365
Operating margin ..................................... 22.8% 24.0% 26.0%
Net revenue for Healthcare increased $98 million or 1.0% in 2006 as compared to 2005. This
increase was largely driven by the International and Surgical divisions within Medical Devices &
Supplies as a result of strong growth across the majority of geographic regions in surgical sales
including laparoscopy, ablation and vessel sealing, and to a lesser extent, sutures. Also contributing to
the revenue increase was volume growth in Bulk Pharmaceuticals (active pharmaceutical ingredients)
and Retail, with growth primarily driven by new product sales and distribution, growth in Latin
America, as well as favorable economic trends and strategic promotional efforts in key markets. These
increases were partially offset by the adverse impact of voluntary product recalls in Imaging and lower
volume sales within Respiratory, in addition to the negative changes in foreign currency exchange rates
of $93 million.
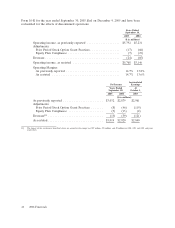
Operating income and operating margin decreased $86 million and 1.2 percentage points,
respectively, as compared to 2005. The increased volume in Medical Devices & Supplies, discussed
above, was more than offset by unfavorable manufacturing performance primarily in Respiratory and
Imaging, as a result of lower volumes and higher expenses primarily associated with voluntary product
recalls, as well as weakness in Retail of $40 million. Also contributing to the decrease in operating
income, although to a lesser extent, was additional investments in research and development and selling
expenses. Operating income was adversely impacted by a charge of $63 million related to purchased
in-process research and development, incremental stock option charges required under SFAS No. 123R
of $37 million, $2 million of charges related to the Proposed Separation and a $31 million negative
46 2006 Financials