ADT 2006 Annual Report Download - page 218
Download and view the complete annual report
Please find page 218 of the 2006 ADT annual report below. You can navigate through the pages in the report by either clicking on the pages listed below, or by using the keyword search tool below to find specific information within the annual report.-
 1
1 -
2
-
3
-
4
-
5
-
6
-
7
-
8
-
9
-
10
-
11
-
12
-
13
-
14
-
15
-
16
-
17
-
18
-
19
-
20
-
21
-
22
-
23
-
24
-
25
-
26
-
27
-
28
-
29
-
30
-
31
-
32
-
33
-
34
-
35
-
36
-
37
-
38
-
39
-
40
-
41
-
42
-
43
-
44
-
45
-
46
-
47
-
48
-
49
-
50
-
51
-
52
-
53
-
54
-
55
-
56
-
57
-
58
-
59
-
60
-
61
-
62
-
63
-
64
-
65
-
66
-
67
-
68
-
69
-
70
-
71
-
72
-
73
-
74
-
75
-
76
-
77
-
78
-
79
-
80
-
81
-
82
-
83
-
84
-
85
-
86
-
87
-
88
-
89
-
90
-
91
-
92
-
93
-
94
-
95
-
96
-
97
-
98
-
99
-
100
-
101
-
102
-
103
-
104
-
105
-
106
-
107
-
108
-
109
-
110
-
111
-
112
-
113
-
114
-
115
-
116
-
117
-
118
-
119
-
120
-
121
-
122
-
123
-
124
-
125
-
126
-
127
-
128
-
129
-
130
-
131
-
132
-
133
-
134
-
135
-
136
-
137
-
138
-
139
-
140
-
141
-
142
-
143
-
144
-
145
-
146
-
147
-
148
-
149
-
150
-
151
-
152
-
153
-
154
-
155
-
156
-
157
-
158
-
159
-
160
-
161
-
162
-
163
-
164
-
165
-
166
-
167
-
168
-
169
-
170
-
171
-
172
-
173
-
174
-
175
-
176
-
177
-
178
-
179
-
180
-
181
-
182
-
183
-
184
-
185
-
186
-
187
-
188
-
189
-
190
-
191
-
192
-
193
-
194
-
195
-
196
-
197
-
198
-
199
-
200
-
201
-
202
-
203
-
204
-
205
-
206
-
207
-
 208
208 -
 209
209 -
 210
210 -
 211
211 -
 212
212 -
 213
213 -
 214
214 -
 215
215 -
 216
216 -
 217
217 -
 218
218 -
 219
219 -
 220
220 -
 221
221 -
 222
222 -
 223
223 -
 224
224 -
 225
225 -
 226
226 -
 227
227 -
 228
228 -
229
-
230
-
231
-
232
 |
 |

TYCO INTERNATIONAL LTD.
NOTES TO CONSOLIDATED FINANCIAL STATEMENTS
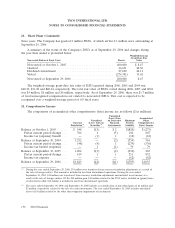
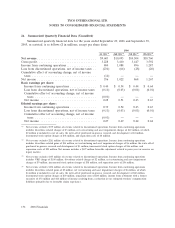
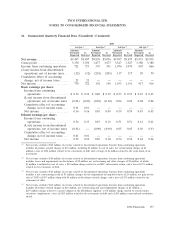
26. Summarized Quarterly Financial Data (Unaudited)
Summarized quarterly financial data for the years ended September 29, 2006 and September 30,
2005, as restated, is as follows ($ in millions, except per share data):
2006
1st Qtr.(1) 2nd Qtr.(2) 3rd Qtr.(3) 4th Qtr.(4)
Net revenue .................................. $9,603 $10,093 $10,504 $10,760
Gross profit .................................. 3,228 3,410 3,447 3,592
Income from continuing operations ................. 804 1,088 896 1,287
Loss from discontinued operations, net of income taxes . . (234) (66) (28) (20)
Cumulative effect of accounting change, net of income
taxes ..................................... (14) — — —
Net income .................................. 556 1,022 868 1,267
Basic earnings per share:
Income from continuing operations ............... $ 0.40 $ 0.54 $ 0.44 $ 0.64
Loss from discontinued operations, net of income taxes (0.11) (0.03) (0.01) (0.01)
Cumulative effect of accounting change, net of income
taxes ................................... (0.01) — — —
Net income ................................ 0.28 0.51 0.43 0.63
Diluted earnings per share:
Income from continuing operations ............... 0.39 0.52 0.43 0.63
Loss from discontinued operations, net of income taxes (0.11) (0.03) (0.01) (0.01)
Cumulative effect of accounting change, net of income
taxes ................................... (0.01) — — —
Net income ................................ 0.27 0.49 0.42 0.62
(1) Net revenue excludes $579 million of revenue related to discontinued operations. Income from continuing operations
includes divestiture-related charges of $3 million, net restructuring and asset impairment charges of $12 million, of which
$2 million is included in cost of sales, the write-off of purchased in-process research and development of $2 million,
incremental stock option charges of $48 million, and separation costs of $8 million.
(2) Net revenue excludes $281 million of revenue related to discontinued operations. Income from continuing operations
includes divestiture-related gains of $44 million, net restructuring and asset impairment charges of $6 million, the write-off of
purchased in-process research and development of $1 million, incremental stock option charges of $46 million, and
separation costs of $25 million. Net income includes a $127 million favorable adjustment related to prior year tax reserves on
legacy matters.
(3) Net revenue excludes $145 million of revenue related to discontinued operations. Income from continuing operations
includes VRP charge of $100 million, divestiture-related charges of $2 million, net restructuring and asset impairment
charges of $9 million, incremental stock option charges of $38 million, and separation costs of $56 million.
(4) Net revenue excludes $106 million of revenue related to discontinued operations. Income from continuing operations
includes divestiture-related gains of $5 million, net restructuring and asset impairment charges of $6 million, of which
$4 million is included in cost of sales, the write-off of purchased in-process research and development of $60 million,
incremental stock option charges of $29 million, separation costs of $80 million, income from settlement with a former
executive of $72 million and $48 million of income resulting from a reduction in our estimated workers’ compensation
liabilities primarily due to favorable claims experience.
156 2006 Financials