ADT 2006 Annual Report Download - page 119
Download and view the complete annual report
Please find page 119 of the 2006 ADT annual report below. You can navigate through the pages in the report by either clicking on the pages listed below, or by using the keyword search tool below to find specific information within the annual report.-
 1
1 -
2
-
3
-
4
-
5
-
6
-
7
-
8
-
9
-
10
-
11
-
12
-
13
-
14
-
15
-
16
-
17
-
18
-
19
-
20
-
21
-
22
-
23
-
24
-
25
-
26
-
27
-
28
-
29
-
30
-
31
-
32
-
33
-
34
-
35
-
36
-
37
-
38
-
39
-
40
-
41
-
42
-
43
-
44
-
45
-
46
-
47
-
48
-
49
-
50
-
51
-
52
-
53
-
54
-
55
-
56
-
57
-
58
-
59
-
60
-
61
-
62
-
63
-
64
-
65
-
66
-
67
-
68
-
69
-
70
-
71
-
72
-
73
-
74
-
75
-
76
-
77
-
78
-
79
-
80
-
81
-
82
-
83
-
84
-
85
-
86
-
87
-
88
-
89
-
90
-
91
-
92
-
93
-
94
-
95
-
96
-
97
-
98
-
99
-
100
-
101
-
102
-
103
-
104
-
105
-
106
-
107
-
108
-
 109
109 -
 110
110 -
 111
111 -
 112
112 -
 113
113 -
 114
114 -
 115
115 -
 116
116 -
 117
117 -
 118
118 -
 119
119 -
 120
120 -
 121
121 -
 122
122 -
 123
123 -
 124
124 -
 125
125 -
 126
126 -
 127
127 -
 128
128 -
 129
129 -
130
-
131
-
132
-
133
-
134
-
135
-
136
-
137
-
138
-
139
-
140
-
141
-
142
-
143
-
144
-
145
-
146
-
147
-
148
-
149
-
150
-
151
-
152
-
153
-
154
-
155
-
156
-
157
-
158
-
159
-
160
-
161
-
162
-
163
-
164
-
165
-
166
-
167
-
168
-
169
-
170
-
171
-
172
-
173
-
174
-
175
-
176
-
177
-
178
-
179
-
180
-
181
-
182
-
183
-
184
-
185
-
186
-
187
-
188
-
189
-
190
-
191
-
192
-
193
-
194
-
195
-
196
-
197
-
198
-
199
-
200
-
201
-
202
-
203
-
204
-
205
-
206
-
207
-
208
-
209
-
210
-
211
-
212
-
213
-
214
-
215
-
216
-
217
-
218
-
219
-
220
-
221
-
222
-
223
-
224
-
225
-
226
-
227
-
228
-
229
-
230
-
231
-
232
 |
 |

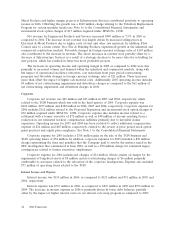
Liquidity and Capital Resources
The sources of our cash flow from operating activities and the use of a portion of that cash in our
operations for the years ended September 29, 2006, and September 30, 2005 and 2004, as restated,
were as follows ($ in millions):
2005 2004
2006 (Restated) (Restated)
Cash flows from operating activities:
Operating income .................................... $5,474 $ 5,768 $ 5,146
Non-cash restructuring and asset impairment charges (credits), net 9 (13) 16
(Gains) losses on divestitures ........................... (44) (271) 111
In-process research and development ...................... 63 — —
Depreciation and amortization(1) ......................... 2,065 2,084 2,098
Non-cash compensation expense ......................... 275 99 121
Deferred income taxes ................................ 72 (28) 167
Provision for losses on accounts receivable and inventory ....... 174 232 317
Other, net(2) ........................................ (47) 148 79
Net increase in working capital .......................... (1,069) (61) (873)
Interest income ..................................... 134 123 91
Interest expense ..................................... (713) (815) (956)
Income tax expense .................................. (799) (1,112) (1,112)
Net cash provided by operating activities ................... $5,594 $ 6,154 $ 5,205
Other cash flow items:
Capital expenditures, net(3) ............................. $(1,514) $(1,263) $ (987)
Decrease in sale of accounts receivable .................... 9 18 929
Acquisition of customer accounts (ADT dealer program) ....... (373) (328) (254)
Purchase accounting and holdback liabilities ................. (19) (47) (104)
Voluntary pension contributions ......................... 2 115 567
(1) Includes depreciation expense of $1,415 million, $1,431 million and $1,407 million in 2006, 2005 and 2004, respectively and
amortization of intangible assets of $650 million, $653 million and $691 million in 2006, 2005 and 2004, respectively.
(2) Includes the add-back of losses on the retirement of debt of $2 million, $1,013 million and $284 million in 2006, 2005 and
2004, respectively.
(3) Includes net proceeds of $55 million, $91 million and $140 million received for the sale/disposition of property, plant and
equipment in 2006, 2005 and 2004, respectively.
The net change in total working capital was a cash decrease of $1,069 million in 2006. The
components of this change are set forth in the Consolidated Statements of Cash Flows. The change in
working capital included an increase of $680 million in inventories and a $332 million decrease in
accrued and other liabilities, primarily related to decreased accrued legal and audit fees, partially offset
by an increase in annual employee bonus compensation.
The provision for losses on accounts receivable and inventory decreased from $232 million during
the year ended September 30, 2005 to $174 million for the current period. This decrease was driven by
improvements across all segments, particularly due to improved accounts receivable aging, an overall
improved credit profile of the customer base, and better collections. Consequently, our allowance for
doubtful accounts decreased from $421 million at September 30, 2005 to $336 million at September 29,
2006.
2006 Financials 57