Wells Fargo 2013 Annual Report Download - page 98
Download and view the complete annual report
Please find page 98 of the 2013 Wells Fargo annual report below. You can navigate through the pages in the report by either clicking on the pages listed below, or by using the keyword search tool below to find specific information within the annual report.-
 1
1 -
2
-
3
-
4
-
5
-
6
-
7
-
8
-
9
-
10
-
11
-
12
-
13
-
14
-
15
-
16
-
17
-
18
-
19
-
20
-
21
-
22
-
23
-
24
-
25
-
26
-
27
-
28
-
29
-
30
-
31
-
32
-
33
-
34
-
35
-
36
-
37
-
38
-
39
-
40
-
41
-
42
-
43
-
44
-
45
-
46
-
47
-
48
-
49
-
50
-
51
-
52
-
53
-
54
-
55
-
56
-
57
-
58
-
59
-
60
-
61
-
62
-
63
-
64
-
65
-
66
-
67
-
68
-
69
-
70
-
71
-
72
-
73
-
74
-
75
-
76
-
77
-
78
-
79
-
80
-
81
-
82
-
83
-
84
-
85
-
86
-
87
-
 88
88 -
 89
89 -
 90
90 -
 91
91 -
 92
92 -
 93
93 -
 94
94 -
 95
95 -
 96
96 -
 97
97 -
 98
98 -
 99
99 -
 100
100 -
 101
101 -
 102
102 -
 103
103 -
 104
104 -
 105
105 -
 106
106 -
 107
107 -
 108
108 -
109
-
110
-
111
-
112
-
113
-
114
-
115
-
116
-
117
-
118
-
119
-
120
-
121
-
122
-
123
-
124
-
125
-
126
-
127
-
128
-
129
-
130
-
131
-
132
-
133
-
134
-
135
-
136
-
137
-
138
-
139
-
140
-
141
-
142
-
143
-
144
-
145
-
146
-
147
-
148
-
149
-
150
-
151
-
152
-
153
-
154
-
155
-
156
-
157
-
158
-
159
-
160
-
161
-
162
-
163
-
164
-
165
-
166
-
167
-
168
-
169
-
170
-
171
-
172
-
173
-
174
-
175
-
176
-
177
-
178
-
179
-
180
-
181
-
182
-
183
-
184
-
185
-
186
-
187
-
188
-
189
-
190
-
191
-
192
-
193
-
194
-
195
-
196
-
197
-
198
-
199
-
200
-
201
-
202
-
203
-
204
-
205
-
206
-
207
-
208
-
209
-
210
-
211
-
212
-
213
-
214
-
215
-
216
-
217
-
218
-
219
-
220
-
221
-
222
-
223
-
224
-
225
-
226
-
227
-
228
-
229
-
230
-
231
-
232
-
233
-
234
-
235
-
236
-
237
-
238
-
239
-
240
-
241
-
242
-
243
-
244
-
245
-
246
-
247
-
248
-
249
-
250
-
251
-
252
-
253
-
254
-
255
-
256
-
257
-
258
-
259
-
260
-
261
-
262
-
263
-
264
-
265
-
266
-
267
-
268
-
269
-
270
-
271
-
272
 |
 |

Risk Management – Asset/Liability Management (continued)
MARKET RISK – EQUITY INVESTMENTS We are directly and
indirectly affected by changes in the equity markets. We make
and manage direct equity investments in start-up businesses,
emerging growth companies, management buy-outs,
acquisitions and corporate recapitalizations. We also invest in
non-affiliated funds that make similar private equity
investments. These private equity investments are made within
capital allocations approved by management and the Board. The
Board’s policy is to review business developments, key risks and
historical returns for the private equity investment portfolio at
least annually. Management reviews the valuations of these
investments at least quarterly and assesses them for possible
OTTI. For nonmarketable investments, the analysis is based on
facts and circumstances of each individual investment and the
expectations for that investment’s cash flows and capital needs,
the viability of its business model and our exit strategy.
Nonmarketable investments include private equity investments
accounted for under the cost method and equity method. Private
equity investments are subject to OTTI.
As part of our business to support our customers, we trade
public equities, listed/OTC equity derivatives and convertible
bonds. We have parameters that govern these activities. We also
have marketable equity securities in the securities available-for-
sale portfolio, including securities relating to our venture capital
activities. We manage these investments within capital risk
limits approved by management and the Board and monitored
by Corporate ALCO. Gains and losses on these securities are
recognized in net income when realized and periodically include
OTTI charges.
Changes in equity market prices may also indirectly affect our
net income by (1) the value of third party assets under
management and, hence, fee income, (2) borrowers whose
ability to repay principal and/or interest may be affected by the
stock market, or (3) brokerage activity, related commission
income and other business activities. Each business line
monitors and manages these indirect risks.
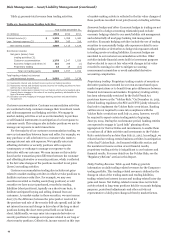
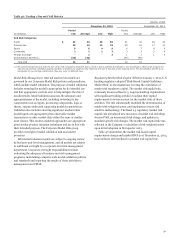
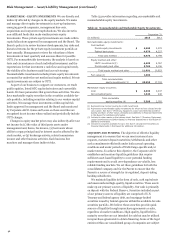
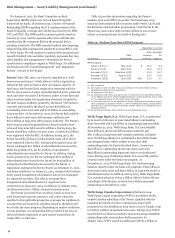
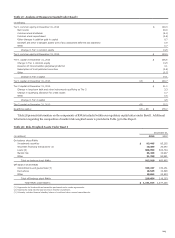
Table 52 provides information regarding our marketable and
nonmarketable equity investments.
Table 52: Nonmarketable and Marketable Equity Investments
December 31,
(in millions) 2013 2012
Nonmarketable equity investments:
Cost method:
Private equity investments $ 2,308 2,572
Federal bank stock 4,670 4,227
Total cost method 6,978 6,799
Equity method and other:
LIHTC investments (1) 6,209 4,767
Private equity and other 5,782 6,156
Total equity method and other 11,991 10,923
Fair value (2) 1,386 -
Total nonmarketable
equity investments (3) $ 20,355 17,722
Marketable equity securities:
Cost $ 2,039 2,337
Net unrealized gains 1,346 448
Total marketable
equity securities (4) $ 3,385 2,785
(1) Represents low income housing tax credit investments.
(2) Represents nonmarketable equity investments for which we have elected the fair
value option. See Note 7 (Premises, Equipment, Lease Commitments and Other
Assets) and Note 17 (Fair Values of Assets and Liabilities) to Financial Statements
in this Report for additional information.
(3) Included in other assets on the balance sheet. See Note 7 (Premises, Equipment,
Lease Commitments and Other Assets) to Financial Statements in this Report for
additional information.
(4) Included in securities available for sale. See Note 5 (Investment Securities) to
Financial Statements in this Report for additional information.
LIQUIDITY AND FUNDING The objective of effective liquidity
management is to ensure that we can meet customer loan
requests, customer deposit maturities/withdrawals and other
cash commitments efficiently under both normal operating
conditions and under periods of Wells Fargo-specific and/or
market stress. To achieve this objective, the Corporate ALCO
establishes and monitors liquidity guidelines that require
sufficient asset-based liquidity to cover potential funding
requirements and to avoid over-dependence on volatile, less
reliable funding markets. We set these guidelines for both the
consolidated company and for the Parent to ensure that the
Parent is a source of strength for its regulated, deposit-taking
banking subsidiaries.
We maintain liquidity in the form of cash, cash equivalents
and unencumbered high-quality, liquid securities. These assets
make up our primary sources of liquidity. Our cash is primarily
on deposit with the Federal Reserve. Securities included as part
of our primary sources of liquidity are comprised of U.S.
Treasury and federal agency debt, and mortgage-backed
securities issued by federal agencies within the available-for-sale
securities portfolio. We believe these securities provide quick
sources of liquidity through repurchase agreements or sales,
regardless of market conditions. High-quality, liquid held-to-
maturity securities are not intended for sale but may be utilized
in repurchase agreements to obtain financing. Some of the legal
entities within our consolidated group of companies are subject
96