Wells Fargo 2013 Annual Report Download - page 225
Download and view the complete annual report
Please find page 225 of the 2013 Wells Fargo annual report below. You can navigate through the pages in the report by either clicking on the pages listed below, or by using the keyword search tool below to find specific information within the annual report.-
 1
1 -
2
-
3
-
4
-
5
-
6
-
7
-
8
-
9
-
10
-
11
-
12
-
13
-
14
-
15
-
16
-
17
-
18
-
19
-
20
-
21
-
22
-
23
-
24
-
25
-
26
-
27
-
28
-
29
-
30
-
31
-
32
-
33
-
34
-
35
-
36
-
37
-
38
-
39
-
40
-
41
-
42
-
43
-
44
-
45
-
46
-
47
-
48
-
49
-
50
-
51
-
52
-
53
-
54
-
55
-
56
-
57
-
58
-
59
-
60
-
61
-
62
-
63
-
64
-
65
-
66
-
67
-
68
-
69
-
70
-
71
-
72
-
73
-
74
-
75
-
76
-
77
-
78
-
79
-
80
-
81
-
82
-
83
-
84
-
85
-
86
-
87
-
88
-
89
-
90
-
91
-
92
-
93
-
94
-
95
-
96
-
97
-
98
-
99
-
100
-
101
-
102
-
103
-
104
-
105
-
106
-
107
-
108
-
109
-
110
-
111
-
112
-
113
-
114
-
115
-
116
-
117
-
118
-
119
-
120
-
121
-
122
-
123
-
124
-
125
-
126
-
127
-
128
-
129
-
130
-
131
-
132
-
133
-
134
-
135
-
136
-
137
-
138
-
139
-
140
-
141
-
142
-
143
-
144
-
145
-
146
-
147
-
148
-
149
-
150
-
151
-
152
-
153
-
154
-
155
-
156
-
157
-
158
-
159
-
160
-
161
-
162
-
163
-
164
-
165
-
166
-
167
-
168
-
169
-
170
-
171
-
172
-
173
-
174
-
175
-
176
-
177
-
178
-
179
-
180
-
181
-
182
-
183
-
184
-
185
-
186
-
187
-
188
-
189
-
190
-
191
-
192
-
193
-
194
-
195
-
196
-
197
-
198
-
199
-
200
-
201
-
202
-
203
-
204
-
205
-
206
-
207
-
208
-
209
-
210
-
211
-
212
-
213
-
214
-
 215
215 -
 216
216 -
 217
217 -
 218
218 -
 219
219 -
 220
220 -
 221
221 -
 222
222 -
 223
223 -
 224
224 -
 225
225 -
 226
226 -
 227
227 -
 228
228 -
 229
229 -
 230
230 -
 231
231 -
 232
232 -
 233
233 -
 234
234 -
 235
235 -
236
-
237
-
238
-
239
-
240
-
241
-
242
-
243
-
244
-
245
-
246
-
247
-
248
-
249
-
250
-
251
-
252
-
253
-
254
-
255
-
256
-
257
-
258
-
259
-
260
-
261
-
262
-
263
-
264
-
265
-
266
-
267
-
268
-
269
-
270
-
271
-
272
 |
 |

$
223
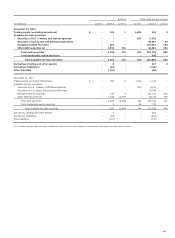
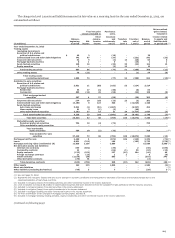
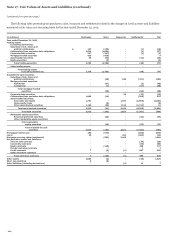
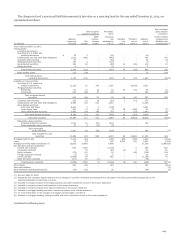
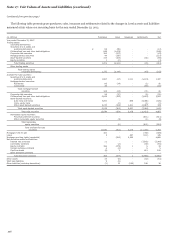
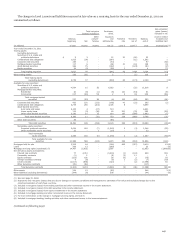
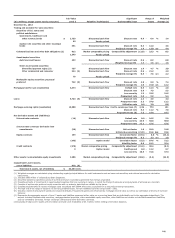
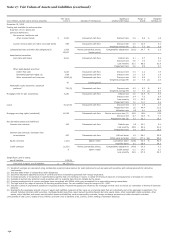
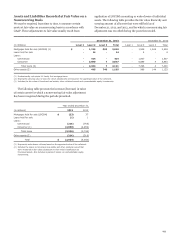
The changes in Level 3 assets and liabilities measured at fair value on a recurring basis for the year ended December 31, 2013, are
summarized as follows:
- - - -
- -
-
- -
-
- - - -
-
- -
-
-
--
-
-
-
- -
- -
- - -
- - -
- - - - - - - -
- - -
-
- -
- - -
- -
- -
-
- -
- - -
- - - - -
-
- - -
- - - - - - - -
- - -
Total net gains
(losses) included in
(in millions)
Balance,
beginning
of period
Net
income
Other
compre-
hensive
income
Purchases,
sales,
issuances
and
settlements,
net (1)
Transfers
into
Level 3
Transfers
out of
Level 3
Balance,
end of
period
Net unrealized
gains (losses)
included in
income related
to assets and
liabilities held
at period end (2)
Year ended December 31, 2013
Trading assets
(excluding derivatives):
Securities of U.S. states and
political subdivisions 46 3 (10) 39
Collateralized loan and other debt obligations 742 67 (37) (231) 541 (33)
Corporate debt securities 52 9 (1) 13 (20) 53 6
Mortgage-backed securities 6 1 9 (15) 1 1
Asset-backed securities 138 16 (35) 25 (22) 122 15
Equity securities 3 (3) 13 13
Total trading securities 987 96 (77) 51 (288) 769 (11)
Other trading assets 76 (22) 1 (1) 54 (8)
Total trading assets
(excluding derivatives) 1,063 74 (77) 52 (289) 823 (19)(3)
Available-for-sale securities:
Securities of U.S. states and
political subdivisions 3,631 11 (85) (182) 53 (214) 3,214
Mortgage-backed securities:
Residential 94 17 (1) (40) (6) 64
Commercial 203 (13) 28 (58) (22) 138 (8)
Total mortgage-backed
securities 297 4 27 (98) (28) 202 (8)
Corporate debt securities 274 10 (10) (13) 23 (3) 281
Collateralized loan and other debt obligations 13,188 8 124 625 (12,525) 1,420
Asset-backed securities:
Auto loans and leases 5,921 (1) (34) (1,067) (4,327) 492
Home equity loans 51 3 (1) (5) (48)
Other asset-backed securities 3,283 27 19 31 24 (1,727) 1,657 (7)
Total asset-backed securities 9,255 29 (16) (1,041) 24 (6,102) 2,149 (7)(4)
Total debt securities 26,645 62 40 (709) 100 (18,872) 7,266 (15)(5)
Marketable equity securities:
Perpetual preferred securities 794 10 (2) (73) 729
Other marketable equity securities
Total marketable
equity securities 794 10 (2) (73) 729 (6)
Total available-for-sale
securities 27,439 72 38 (782) 100 (18,872) 7,995 (15)
Mortgages held for sale 3,250 5 (874) 336 (343) 2,374 (74)(7)
Loans 6,021 (211) 106 (193) 5,723 (178)(7)
Mortgage servicing rights (residential) (8) 11,538 1,156 2,886 15,580 3,398 (7)
Net derivative assets and liabilities:
Interest rate contracts 659 (662) (39) 2 (40) (186)
Commodity contracts 21 (66) (1) 36 (10) (19)
Equity contracts (122) (151)137 (14) 104 (46) 48
Foreign exchange contracts 21 (15) 1 2 9 (8)
Credit contracts (1,150) (30) 805 (375) 345
Other derivative contracts (78) 75 (3)
Total derivative contracts (649) (783) 838 (13) 142 (465) 180 (9)
Other assets 162 315 1,026 1,503 (2)(3)
Short sale liabilities (3)
Other liabilities (excluding derivatives) (49) 3 7 (39) 5 (7)
(1) See next page for detail.
(2) Represents only net gains (losses) that are due to changes in economic conditions and management’s estimates of fair value and excludes changes due to the
collection/realization of cash flows over time.
(3) Included in net gains (losses) from trading activities and other noninterest income in the income statement.
(4) Level 3 transfers out include $6.0 billion in asset-backed securities that were transferred from the available-for-sale portfolio to held-to-maturity securities.
(5) Included in net gains (losses) from debt securities in the income statement.
(6) Included in net gains (losses) from equity investments in the income statement.
(7) Included in mortgage banking and other noninterest income in the income statement.
(8) For more information on the changes in mortgage servicing rights, see Note 9.
(9) Included in mortgage banking, trading activities, equity investments and other noninterest income in the income statement.
(continued on following page)