Wells Fargo 2013 Annual Report Download - page 58
Download and view the complete annual report
Please find page 58 of the 2013 Wells Fargo annual report below. You can navigate through the pages in the report by either clicking on the pages listed below, or by using the keyword search tool below to find specific information within the annual report.-
 1
1 -
2
-
3
-
4
-
5
-
6
-
7
-
8
-
9
-
10
-
11
-
12
-
13
-
14
-
15
-
16
-
17
-
18
-
19
-
20
-
21
-
22
-
23
-
24
-
25
-
26
-
27
-
28
-
29
-
30
-
31
-
32
-
33
-
34
-
35
-
36
-
37
-
38
-
39
-
40
-
41
-
42
-
43
-
44
-
45
-
46
-
47
-
 48
48 -
 49
49 -
 50
50 -
 51
51 -
 52
52 -
 53
53 -
 54
54 -
 55
55 -
 56
56 -
 57
57 -
 58
58 -
 59
59 -
 60
60 -
 61
61 -
 62
62 -
 63
63 -
 64
64 -
 65
65 -
 66
66 -
 67
67 -
 68
68 -
69
-
70
-
71
-
72
-
73
-
74
-
75
-
76
-
77
-
78
-
79
-
80
-
81
-
82
-
83
-
84
-
85
-
86
-
87
-
88
-
89
-
90
-
91
-
92
-
93
-
94
-
95
-
96
-
97
-
98
-
99
-
100
-
101
-
102
-
103
-
104
-
105
-
106
-
107
-
108
-
109
-
110
-
111
-
112
-
113
-
114
-
115
-
116
-
117
-
118
-
119
-
120
-
121
-
122
-
123
-
124
-
125
-
126
-
127
-
128
-
129
-
130
-
131
-
132
-
133
-
134
-
135
-
136
-
137
-
138
-
139
-
140
-
141
-
142
-
143
-
144
-
145
-
146
-
147
-
148
-
149
-
150
-
151
-
152
-
153
-
154
-
155
-
156
-
157
-
158
-
159
-
160
-
161
-
162
-
163
-
164
-
165
-
166
-
167
-
168
-
169
-
170
-
171
-
172
-
173
-
174
-
175
-
176
-
177
-
178
-
179
-
180
-
181
-
182
-
183
-
184
-
185
-
186
-
187
-
188
-
189
-
190
-
191
-
192
-
193
-
194
-
195
-
196
-
197
-
198
-
199
-
200
-
201
-
202
-
203
-
204
-
205
-
206
-
207
-
208
-
209
-
210
-
211
-
212
-
213
-
214
-
215
-
216
-
217
-
218
-
219
-
220
-
221
-
222
-
223
-
224
-
225
-
226
-
227
-
228
-
229
-
230
-
231
-
232
-
233
-
234
-
235
-
236
-
237
-
238
-
239
-
240
-
241
-
242
-
243
-
244
-
245
-
246
-
247
-
248
-
249
-
250
-
251
-
252
-
253
-
254
-
255
-
256
-
257
-
258
-
259
-
260
-
261
-
262
-
263
-
264
-
265
-
266
-
267
-
268
-
269
-
270
-
271
-
272
 |
 |
Risk Management – Credit Risk Management (continued)
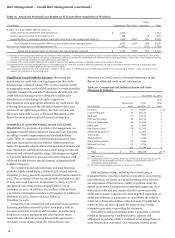
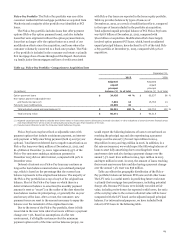
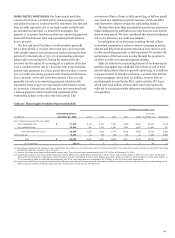
PURCHASED CREDIT-IMPAIRED (PCI) LOANS Loans
acquired with evidence of credit deterioration since their
origination and where it is probable that we will not collect all
contractually required principal and interest payments are PCI
loans. Substantially all of our PCI loans were acquired in the
Wachovia acquisition on December 31, 2008. PCI loans are
recorded at fair value at the date of acquisition, and the
historical allowance for credit losses related to these loans is not
carried over. The carrying value of PCI loans totaled
$26.7 billion at December 31, 2013, down from $31.0 billion and
$58.8 billion at December 31, 2012 and 2008, respectively. Such
loans are considered to be accruing due to the existence of the
accretable yield and not based on consideration given to
contractual interest payments. The accretable yield at
December 31, 2013, was $17.4 billion, which reflects a revision
from the $19.1 billion reported in our earnings release, filed
January 14, 2014, on Form 8-K. This revision primarily reflects a
correction of our projected cash flow estimates for our Pick-a-
Pay portfolio related to the anticipated volume of future
modifications and defaults on modified loans. As a result, the
estimated weighted-average life of our projected cash flow
estimates for our Pick-a-Pay portfolio declined from 14.0 years
to 12.7 years.
A nonaccretable difference is established for PCI loans to
absorb losses expected on those loans at the date of acquisition.
Amounts absorbed by the nonaccretable difference do not affect
the income statement or the allowance for credit losses.
Substantially all commercial and industrial, CRE and foreign
PCI loans are accounted for as individual loans. Conversely,
Pick-a-Pay and other consumer PCI loans have been aggregated
into pools based on common risk characteristics. Each pool is
accounted for as a single asset with a single composite interest
rate and an aggregate expectation of cash flows.
Resolutions of loans may include sales to third parties,
receipt of payments in settlement with the borrower, or
foreclosure of the collateral. Our policy is to remove an
individual PCI loan from a pool based on comparing the amount
received from its resolution with its contractual amount. Any
difference between these amounts is absorbed by the
nonaccretable difference. This removal method assumes that the
amount received from resolution approximates pool
performance expectations. The accretable yield percentage is
unaffected by the resolution and any changes in the effective
yield for the remaining loans in the pool are addressed by our
quarterly cash flow evaluation process for each pool. For loans
that are resolved by payment in full, there is no release of the
nonaccretable difference for the pool because there is no
difference between the amount received at resolution and the
contractual amount of the loan. Modified PCI loans are not
removed from a pool even if those loans would otherwise be
deemed TDRs. Modified PCI loans that are accounted for
individually are TDRs, and removed from PCI accounting, if
there has been a concession granted in excess of the original
nonaccretable difference. We include these TDRs in our
impaired loans.
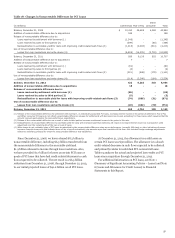
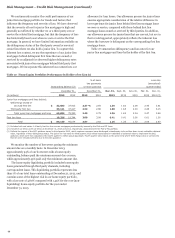
During 2013, we recognized as income $91 million released
from the nonaccretable difference related to commercial PCI
loans due to payoffs and other resolutions. We also transferred
$971 million from the nonaccretable difference to the accretable
yield for PCI loans with improving credit-related cash flows and
absorbed $751 million of losses in the nonaccretable difference
from loan resolutions and write-downs. Our cash flows expected
to be collected have been favorably affected by lower than
expected defaults and losses as a result of observed economic
strengthening, particularly in housing prices, and by our loan
modification efforts. See the “Real Estate 1-4 Family First and
Junior Lien Mortgage Loans” section in this Report for
additional information. Table 18 provides an analysis of changes
in the nonaccretable difference.
56