Wells Fargo 2013 Annual Report Download - page 235
Download and view the complete annual report
Please find page 235 of the 2013 Wells Fargo annual report below. You can navigate through the pages in the report by either clicking on the pages listed below, or by using the keyword search tool below to find specific information within the annual report.-
 1
1 -
2
-
3
-
4
-
5
-
6
-
7
-
8
-
9
-
10
-
11
-
12
-
13
-
14
-
15
-
16
-
17
-
18
-
19
-
20
-
21
-
22
-
23
-
24
-
25
-
26
-
27
-
28
-
29
-
30
-
31
-
32
-
33
-
34
-
35
-
36
-
37
-
38
-
39
-
40
-
41
-
42
-
43
-
44
-
45
-
46
-
47
-
48
-
49
-
50
-
51
-
52
-
53
-
54
-
55
-
56
-
57
-
58
-
59
-
60
-
61
-
62
-
63
-
64
-
65
-
66
-
67
-
68
-
69
-
70
-
71
-
72
-
73
-
74
-
75
-
76
-
77
-
78
-
79
-
80
-
81
-
82
-
83
-
84
-
85
-
86
-
87
-
88
-
89
-
90
-
91
-
92
-
93
-
94
-
95
-
96
-
97
-
98
-
99
-
100
-
101
-
102
-
103
-
104
-
105
-
106
-
107
-
108
-
109
-
110
-
111
-
112
-
113
-
114
-
115
-
116
-
117
-
118
-
119
-
120
-
121
-
122
-
123
-
124
-
125
-
126
-
127
-
128
-
129
-
130
-
131
-
132
-
133
-
134
-
135
-
136
-
137
-
138
-
139
-
140
-
141
-
142
-
143
-
144
-
145
-
146
-
147
-
148
-
149
-
150
-
151
-
152
-
153
-
154
-
155
-
156
-
157
-
158
-
159
-
160
-
161
-
162
-
163
-
164
-
165
-
166
-
167
-
168
-
169
-
170
-
171
-
172
-
173
-
174
-
175
-
176
-
177
-
178
-
179
-
180
-
181
-
182
-
183
-
184
-
185
-
186
-
187
-
188
-
189
-
190
-
191
-
192
-
193
-
194
-
195
-
196
-
197
-
198
-
199
-
200
-
201
-
202
-
203
-
204
-
205
-
206
-
207
-
208
-
209
-
210
-
211
-
212
-
213
-
214
-
215
-
216
-
217
-
218
-
219
-
220
-
221
-
222
-
223
-
224
-
 225
225 -
 226
226 -
 227
227 -
 228
228 -
 229
229 -
 230
230 -
 231
231 -
 232
232 -
 233
233 -
 234
234 -
 235
235 -
 236
236 -
 237
237 -
 238
238 -
 239
239 -
 240
240 -
 241
241 -
 242
242 -
 243
243 -
 244
244 -
 245
245 -
246
-
247
-
248
-
249
-
250
-
251
-
252
-
253
-
254
-
255
-
256
-
257
-
258
-
259
-
260
-
261
-
262
-
263
-
264
-
265
-
266
-
267
-
268
-
269
-
270
-
271
-
272
 |
 |

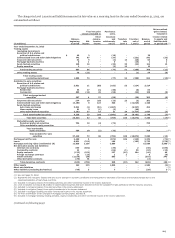
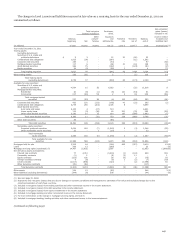
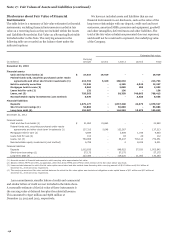
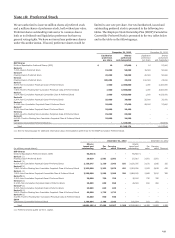
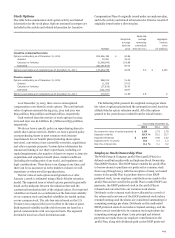
Assets and Liabilities Recorded at Fair Value on a
Nonrecurring Basis
We may be required, from time to time, to measure certain
assets at fair value on a nonrecurring basis in accordance with
GAAP. These adjustments to fair value usually result from
application of LOCOM accounting or write-downs of individual
assets. The following table provides the fair value hierarchy and
carrying amount of all assets that were still held as of
December 31, 2013, and 2012, and for which a nonrecurring fair
adjustment was recorded during the years then ended.
December 31, 2013 December 31, 2012
(in millions) Level 1 Level 2 Level 3 Total Level 1 Level 2 Level 3 Total
Mortgages held for sale (LOCOM) (1) $ - 1,126 893 2,019 -1,509 1,045 2,554
Loans held for sale - 14 - 14 - 4 - 4
Loans:
Commercial - 414 - 414 -1,507 - 1,507
Consumer - 3,690 7 3,697 -5,889 4 5,893
Total loans (2) - 4,104 7 4,111 -7,396 4 7,400
Other assets (3) - 445 740 1,185 -989 144 1,133
(1) Predominantly real estate 1-4 family first mortgage loans.
(2) Represents carrying value of loans for which adjustments are based on the appraised value of the collateral.
(3) Includes the fair value of foreclosed real estate, other collateral owned and nonmarketable equity investments.
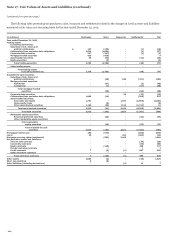
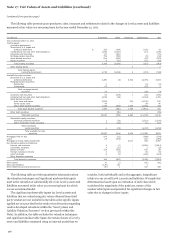
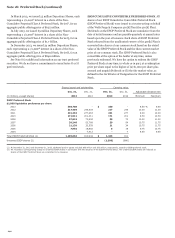
The following table presents the increase (decrease) in value
of certain assets for which a nonrecurring fair value adjustment
has been recognized during the periods presented.
Year ended December 31,
(in millions) 2013 2012
Mortgages held for sale (LOCOM) $ (23) 37
Loans held for sale (1) 1
Loans:
Commercial (216) (795)
Consumer (1) (2,050) (4,989)
Total loans (2,266) (5,784)
Other assets (2) (214) (316)
Total $ (2,504) (6,062)
233
(1) Represents write-downs of loans based on the appraised value of the collateral.
(2) Includes the losses on foreclosed real estate and other collateral owned that
were measured at fair value subsequent to their initial classification as
foreclosed assets. Also includes impairment losses on nonmarketable equity
investments.