Wells Fargo 2013 Annual Report Download - page 39
Download and view the complete annual report
Please find page 39 of the 2013 Wells Fargo annual report below. You can navigate through the pages in the report by either clicking on the pages listed below, or by using the keyword search tool below to find specific information within the annual report.-
 1
1 -
2
-
3
-
4
-
5
-
6
-
7
-
8
-
9
-
10
-
11
-
12
-
13
-
14
-
15
-
16
-
17
-
18
-
19
-
20
-
21
-
22
-
23
-
24
-
25
-
26
-
27
-
28
-
 29
29 -
 30
30 -
 31
31 -
 32
32 -
 33
33 -
 34
34 -
 35
35 -
 36
36 -
 37
37 -
 38
38 -
 39
39 -
 40
40 -
 41
41 -
 42
42 -
 43
43 -
 44
44 -
 45
45 -
 46
46 -
 47
47 -
 48
48 -
 49
49 -
50
-
51
-
52
-
53
-
54
-
55
-
56
-
57
-
58
-
59
-
60
-
61
-
62
-
63
-
64
-
65
-
66
-
67
-
68
-
69
-
70
-
71
-
72
-
73
-
74
-
75
-
76
-
77
-
78
-
79
-
80
-
81
-
82
-
83
-
84
-
85
-
86
-
87
-
88
-
89
-
90
-
91
-
92
-
93
-
94
-
95
-
96
-
97
-
98
-
99
-
100
-
101
-
102
-
103
-
104
-
105
-
106
-
107
-
108
-
109
-
110
-
111
-
112
-
113
-
114
-
115
-
116
-
117
-
118
-
119
-
120
-
121
-
122
-
123
-
124
-
125
-
126
-
127
-
128
-
129
-
130
-
131
-
132
-
133
-
134
-
135
-
136
-
137
-
138
-
139
-
140
-
141
-
142
-
143
-
144
-
145
-
146
-
147
-
148
-
149
-
150
-
151
-
152
-
153
-
154
-
155
-
156
-
157
-
158
-
159
-
160
-
161
-
162
-
163
-
164
-
165
-
166
-
167
-
168
-
169
-
170
-
171
-
172
-
173
-
174
-
175
-
176
-
177
-
178
-
179
-
180
-
181
-
182
-
183
-
184
-
185
-
186
-
187
-
188
-
189
-
190
-
191
-
192
-
193
-
194
-
195
-
196
-
197
-
198
-
199
-
200
-
201
-
202
-
203
-
204
-
205
-
206
-
207
-
208
-
209
-
210
-
211
-
212
-
213
-
214
-
215
-
216
-
217
-
218
-
219
-
220
-
221
-
222
-
223
-
224
-
225
-
226
-
227
-
228
-
229
-
230
-
231
-
232
-
233
-
234
-
235
-
236
-
237
-
238
-
239
-
240
-
241
-
242
-
243
-
244
-
245
-
246
-
247
-
248
-
249
-
250
-
251
-
252
-
253
-
254
-
255
-
256
-
257
-
258
-
259
-
260
-
261
-
262
-
263
-
264
-
265
-
266
-
267
-
268
-
269
-
270
-
271
-
272
 |
 |

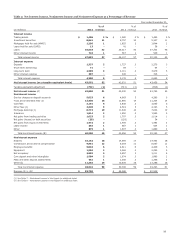
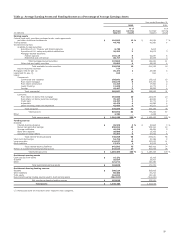
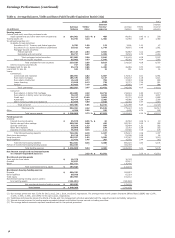
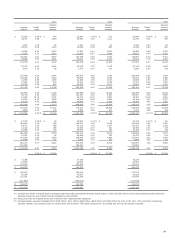
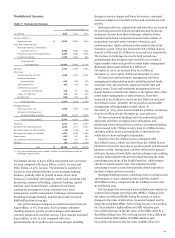
Table 4: Average Earning Assets and Funding Sources as a Percentage of Average Earnings Assets
Year ended December 31,
2013 2012
(in millions)
Average
balance
% of
earning
assets
Averag
balance
% of
e earning
assets
Earning assets
Federal funds sold, securities purchased under resale agreements
and other short-term investments $ 154,902 12 % $ 84,081 7 %
Trading assets 44,745 4 41,950 4
Investment securities:
Available-for-sale securities:
Securities of U.S. Treasury and federal agencies 6,750 1 3,604 -
Securities of U.S. states and political subdivisions
Mortgage-backed securities:
39,922 3 34,875 3
Federal agencies 107,148 8 92,887 8
Residential and commercial 30,717 3 33,545 3
Total mortgage-backed securities 137,865 11 126,432 11
Other debt and equity securities 55,002 4 49,245 4
Total available-for-sale securities 239,539 19 214,156 18
Held-to-maturity securities 717 - - -
Mortgages held for sale (1) 35,273 3 48,955 4
Loans held for sale (1) 163 - 661 -
Loans:
Commercial:
Commercial and industrial 188,092 15 173,913 15
Real estate mortgage 105,475 8 105,437 9
Real estate construction 16,445 1 17,963 2
Lease financing 12,048 1 12,771 1
Foreign 43,447 3 39,852 4
Total commercial 365,507 28 349,936 31
Consumer:
Real estate 1-4 family first mortgage 254,000 20 234,619 20
Real estate 1-4 family junior lien mortgag 70,227 5 80,840 7
Credit card 24,747 2 22,772 2
Automobile 48,476 4 44,986 4
Other revolving credit and installment 42,035 3 42,071 3
Total consumer 439,485 34 425,288 36
Total loans (1) 804,992 62 775,224 67
Other 4,354 - 4,438 -
Total earning assets $ 1,284,685 100 % $ 1,169,465 100 %
Funding sources
Deposits:
Interest-bearing checking $ 35,570 3 % $ 30,564 3 %
Market rate and other savings 550,394 43 505,310 43
Savings certificates 49,510 4 59,484 5
Other time deposits 28,090 2 13,363 1
Deposits in foreign offices 76,894 6 67,920 6
Total interest-bearing deposits 740,458 58 676,641 58
Short-term borrowings 54,716 4 51,196 4
Long-term debt 134,937 10 127,547 11
Other liabilities 12,471 1 10,032 1
Total interest-bearing liabilities 942,582 73 865,416 74
Portion of noninterest-bearing funding sources 342,103 27 304,049 26
Total funding sources $ 1,284,685 100 % $ 1,169,465 100 %
Noninterest-earning assets
Cash and due from banks $ 16,272 16,303
Goodwill 25,637 25,417
Other 121,711 130,450
Total noninterest-earning assets $ 163,620 172,170
Noninterest-bearing funding sources
Deposits $ 280,229 263,863
Other liabilities 60,500 61,214
Total equity 164,994 151,142
Noninterest-bearing funding sources used to fund earning assets (342,103) (304,049)
Net noninterest-bearing funding sources $ 163,620 172,170
Total assets $ 1,448,305 1,341,635
(1) Nonaccrual loans are included in their respective loan categories.
37