Wells Fargo 2013 Annual Report Download - page 257
Download and view the complete annual report
Please find page 257 of the 2013 Wells Fargo annual report below. You can navigate through the pages in the report by either clicking on the pages listed below, or by using the keyword search tool below to find specific information within the annual report.-
 1
1 -
2
-
3
-
4
-
5
-
6
-
7
-
8
-
9
-
10
-
11
-
12
-
13
-
14
-
15
-
16
-
17
-
18
-
19
-
20
-
21
-
22
-
23
-
24
-
25
-
26
-
27
-
28
-
29
-
30
-
31
-
32
-
33
-
34
-
35
-
36
-
37
-
38
-
39
-
40
-
41
-
42
-
43
-
44
-
45
-
46
-
47
-
48
-
49
-
50
-
51
-
52
-
53
-
54
-
55
-
56
-
57
-
58
-
59
-
60
-
61
-
62
-
63
-
64
-
65
-
66
-
67
-
68
-
69
-
70
-
71
-
72
-
73
-
74
-
75
-
76
-
77
-
78
-
79
-
80
-
81
-
82
-
83
-
84
-
85
-
86
-
87
-
88
-
89
-
90
-
91
-
92
-
93
-
94
-
95
-
96
-
97
-
98
-
99
-
100
-
101
-
102
-
103
-
104
-
105
-
106
-
107
-
108
-
109
-
110
-
111
-
112
-
113
-
114
-
115
-
116
-
117
-
118
-
119
-
120
-
121
-
122
-
123
-
124
-
125
-
126
-
127
-
128
-
129
-
130
-
131
-
132
-
133
-
134
-
135
-
136
-
137
-
138
-
139
-
140
-
141
-
142
-
143
-
144
-
145
-
146
-
147
-
148
-
149
-
150
-
151
-
152
-
153
-
154
-
155
-
156
-
157
-
158
-
159
-
160
-
161
-
162
-
163
-
164
-
165
-
166
-
167
-
168
-
169
-
170
-
171
-
172
-
173
-
174
-
175
-
176
-
177
-
178
-
179
-
180
-
181
-
182
-
183
-
184
-
185
-
186
-
187
-
188
-
189
-
190
-
191
-
192
-
193
-
194
-
195
-
196
-
197
-
198
-
199
-
200
-
201
-
202
-
203
-
204
-
205
-
206
-
207
-
208
-
209
-
210
-
211
-
212
-
213
-
214
-
215
-
216
-
217
-
218
-
219
-
220
-
221
-
222
-
223
-
224
-
225
-
226
-
227
-
228
-
229
-
230
-
231
-
232
-
233
-
234
-
235
-
236
-
237
-
238
-
239
-
240
-
241
-
242
-
243
-
244
-
245
-
246
-
 247
247 -
 248
248 -
 249
249 -
 250
250 -
 251
251 -
 252
252 -
 253
253 -
 254
254 -
 255
255 -
 256
256 -
 257
257 -
 258
258 -
 259
259 -
 260
260 -
 261
261 -
 262
262 -
 263
263 -
 264
264 -
 265
265 -
 266
266 -
 267
267 -
268
-
269
-
270
-
271
-
272
 |
 |

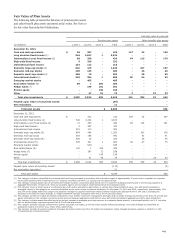
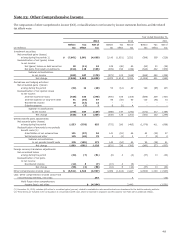
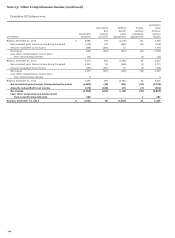
Note 23: Other Comprehensive Income
The components of other comprehensive income (OCI), reclassifications to net income by income statement line item, and the related
tax effects were:
Year ended December 31,
2013 2012 2011
(in millions)
Before
tax
Tax
effect
Net of
tax
Before
tax
Tax
effect
Net of
tax
Before
tax
Tax
effect
Net of
tax
Investment securities:
Net unrealized gains (losses)
arising during the period (1) $ (7,661) 2,981 (4,680) 5,143 (1,921) 3,222 (588) 359 (229)
Reclassification of net (gains) losses
to net income:
Net (gains) losses on debt securities 29 (11) 18 128 (48) 80 (54) 20 (34)
Net gains from equity investments (314) 118 (196) (399) 150 (249) (642) 242 (400)
Subtotal reclassifications
to net income (285) 107 (178) (271) 102 (169) (696) 262 (434)
Net change (7,946) 3,088 (4,858) 4,872 (1,819) 3,053 (1,284) 621 (663)
Derivatives and hedging activities:
Net unrealized gains (losses)
arising during the period (32) 12 (20) 52 (12) 40 190 (85) 105
Reclassification of net (gains) losses
to net income:
Interest income on loans (426) 156 (270) (490) 185 (305) (686) 259 (427)
Interest expense on long-term debt 91 (34) 57 96 (36) 60 115 (42) 73
Noninterest income 35 (13) 22 - - - - - -
Salaries expense 4 (2) 2 6 (2) 4 - - -
Subtotal reclassifications
to net income (296) 107 (189) (388) 147 (241) (571) 217 (354)
Net change (328) 119 (209) (336) 135 (201) (381) 132 (249)
Defined benefit plans adjustments:
Net actuarial gains (losses)
arising during the period 1,533 (578) 955 (775) 290 (485) (1,079) 411 (668)
Reclassification of amounts to net periodic
benefit costs (2):
Amortization of net actuarial loss 151 (57) 94 141 (53) 88 92 (35) 57
Settlements and other 125 (46) 79 3 (1) 2 7 (3) 4
Subtotal reclassifications
to net periodic benefit costs 276 (103) 173 144 (54) 90 99 (38) 61
Net change 1,809 (681) 1,128 (631) 236 (395) (980) 373 (607)
Foreign currency translation adjustments:
Net unrealized losses
arising during the period (44) (7) (51) (6) 2 (4) (37) 13 (24)
Reclassification of net gains
to net income:
Noninterest income (12) 5 (7) (10) 4 (6) - - -
Net change (56) (2) (58) (16) 6 (10) (37) 13 (24)
Other comprehensive income (loss) $ (6,521) 2,524 (3,997) 3,889 (1,442) 2,447 (2,682) 1,139 (1,543)
Less: Other comprehensive income (loss) from
noncontrolling interests, net of tax 267 4 (12)
Wells Fargo other comprehensive
income (loss), net of tax $ (4,264) 2,443 (1,531)
(1) December 31, 2013, includes $46 million in unrealized gains (pre-tax) related to available-for-sale securities that were transferred to the held-to-maturity portfolio.
(2) These items are included in the computation of net periodic benefit cost, which is recorded in employee benefits expense (see Note 20 for additional details).
255