Wells Fargo 2013 Annual Report Download - page 203
Download and view the complete annual report
Please find page 203 of the 2013 Wells Fargo annual report below. You can navigate through the pages in the report by either clicking on the pages listed below, or by using the keyword search tool below to find specific information within the annual report.-
 1
1 -
2
-
3
-
4
-
5
-
6
-
7
-
8
-
9
-
10
-
11
-
12
-
13
-
14
-
15
-
16
-
17
-
18
-
19
-
20
-
21
-
22
-
23
-
24
-
25
-
26
-
27
-
28
-
29
-
30
-
31
-
32
-
33
-
34
-
35
-
36
-
37
-
38
-
39
-
40
-
41
-
42
-
43
-
44
-
45
-
46
-
47
-
48
-
49
-
50
-
51
-
52
-
53
-
54
-
55
-
56
-
57
-
58
-
59
-
60
-
61
-
62
-
63
-
64
-
65
-
66
-
67
-
68
-
69
-
70
-
71
-
72
-
73
-
74
-
75
-
76
-
77
-
78
-
79
-
80
-
81
-
82
-
83
-
84
-
85
-
86
-
87
-
88
-
89
-
90
-
91
-
92
-
93
-
94
-
95
-
96
-
97
-
98
-
99
-
100
-
101
-
102
-
103
-
104
-
105
-
106
-
107
-
108
-
109
-
110
-
111
-
112
-
113
-
114
-
115
-
116
-
117
-
118
-
119
-
120
-
121
-
122
-
123
-
124
-
125
-
126
-
127
-
128
-
129
-
130
-
131
-
132
-
133
-
134
-
135
-
136
-
137
-
138
-
139
-
140
-
141
-
142
-
143
-
144
-
145
-
146
-
147
-
148
-
149
-
150
-
151
-
152
-
153
-
154
-
155
-
156
-
157
-
158
-
159
-
160
-
161
-
162
-
163
-
164
-
165
-
166
-
167
-
168
-
169
-
170
-
171
-
172
-
173
-
174
-
175
-
176
-
177
-
178
-
179
-
180
-
181
-
182
-
183
-
184
-
185
-
186
-
187
-
188
-
189
-
190
-
191
-
192
-
 193
193 -
 194
194 -
 195
195 -
 196
196 -
 197
197 -
 198
198 -
 199
199 -
 200
200 -
 201
201 -
 202
202 -
 203
203 -
 204
204 -
 205
205 -
 206
206 -
 207
207 -
 208
208 -
 209
209 -
 210
210 -
 211
211 -
 212
212 -
 213
213 -
214
-
215
-
216
-
217
-
218
-
219
-
220
-
221
-
222
-
223
-
224
-
225
-
226
-
227
-
228
-
229
-
230
-
231
-
232
-
233
-
234
-
235
-
236
-
237
-
238
-
239
-
240
-
241
-
242
-
243
-
244
-
245
-
246
-
247
-
248
-
249
-
250
-
251
-
252
-
253
-
254
-
255
-
256
-
257
-
258
-
259
-
260
-
261
-
262
-
263
-
264
-
265
-
266
-
267
-
268
-
269
-
270
-
271
-
272
 |
 |

- -
- - - - -
- -
-
- - - -
-
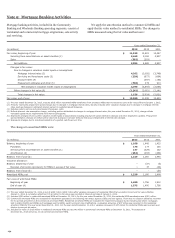
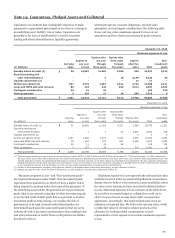
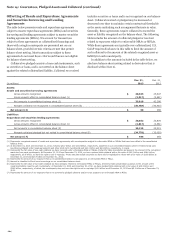
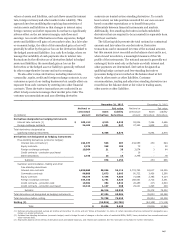
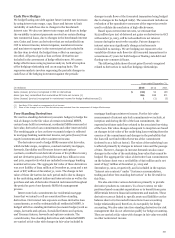
Note 14: Guarantees, Pledged Assets and Collateral
Guarantees are contracts that contingently require us to make
payments to a guaranteed party based on an event or a change in
an underlying asset, liability, rate or index. Guarantees are
generally in the form of standby letters of credit, securities
lending and other indemnifications, liquidity agreements,
written put options, recourse obligations, residual value
guarantees, and contingent consideration. The following table
shows carrying value, maximum exposure to loss on our
guarantees and the related non-investment grade amounts.
December 31, 2013
Maximum exposure to loss
$
$
$
$
(in millions)
Carrying
value
Expires in
one year
or less
Expires after
one year
through
three years
Expires after
three years
through
five years
Expires
after five
years Total
Non-
investment
grade
Standby letters of credit (1) 56 16,907 11,628 5,308 994 34,837 9,512
Securities lending and
other indemnifications 3 18 3,199 3,220 25
Liquidity agreements (2) 17 17
Written put options (3) 907 4,775 2,967 3,521 2,725 13,988 4,311
Loans and MHFS sold with recourse 86 116 418 849 5,014 6,397 3,674
Contingent consideration 30 15 94 109 109
Other guarantees 3 329 17 16 954 1,316 4
Total guarantees 1,082 22,142 15,127 9,712 12,903 59,884 17,635
December 31, 2012
Maximum exposure to loss
(in millions)
Carrying
value
Expires in
one year
or less
Expires after
one year
through
three years
Expires after
three years
through
five years
Expires after
five years Total
Non-
investment
grade
Standby letters of credit (1) 42 19,463 11,782 6,531 1,983 39,759 11,331
Securities lending and
other indemnifications 3 7 20 2,511 2,541 118
Liquidity agreements (2) 3 3 3
Written put options (2)(3) 1,427 2,951 3,873 2,475 2,575 11,874 3,953
Loans and MHFS sold with recourse 99 443 357 647 4,426 5,873 3,905
Contingent consideration 35 11 24 94 129 129
Other guarantees 3 677 26 1 717 1,421 4
Total guarantees 1,606 23,548 16,069 9,768 12,215 61,600 19,443
(1) Total maximum exposure to loss includes direct pay letters of credit (DPLCs) of $16.8 billion and $18.5 billion at December 31, 2013 and December 31, 2012, respectively.
We issue DPLCs to provide credit enhancements for certain bond issuances. Beneficiaries (bond trustees) may draw upon these instruments to make scheduled principal and
interest payments, redeem all outstanding bonds because a default event has occurred, or for other reasons as permitted by the agreement. We also originate multipurpose
lending commitments under which borrowers have the option to draw on the facility in one of several forms, including as a standby letter of credit. Total maximum exposure
to loss includes the portion of these facilities for which we have issued standby letters of credit under the commitments.
(2) Certain of these agreements included in this table are related to off-balance sheet entities and, accordingly, are also disclosed in Note 8.
(3) Written put options, which are in the form of derivatives, are also included in the derivative disclosures in Note 16.
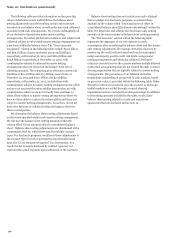
“Maximum exposure to loss” and “Non-investment grade”
are required disclosures under GAAP. Non-investment grade
represents those guarantees on which we have a higher risk of
being required to perform under the terms of the guarantee. If
the underlying assets under the guarantee are non-investment
grade (that is, an external rating that is below investment grade
or an internal credit default grade that is equivalent to a below
investment grade external rating), we consider the risk of
performance to be high. Internal credit default grades are
determined based upon the same credit policies that we use to
evaluate the risk of payment or performance when making loans
and other extensions of credit. These credit policies are further
described in Note 6.
Maximum exposure to loss represents the estimated loss that
would be incurred under an assumed hypothetical circumstance,
despite what we believe is its extremely remote possibility, where
the value of our interests and any associated collateral declines
to zero. Maximum exposure to loss estimates in the table above
do not reflect economic hedges or collateral we could use to
offset or recover losses we may incur under our guarantee
agreements. Accordingly, this required disclosure is not an
indication of expected loss. We believe the carrying value, which
is either fair value for derivative related products or the
allowance for lending related commitments, is more
representative of our exposure to loss than maximum exposure
to loss.
201