Wells Fargo 2013 Annual Report Download - page 104
Download and view the complete annual report
Please find page 104 of the 2013 Wells Fargo annual report below. You can navigate through the pages in the report by either clicking on the pages listed below, or by using the keyword search tool below to find specific information within the annual report.-
 1
1 -
2
-
3
-
4
-
5
-
6
-
7
-
8
-
9
-
10
-
11
-
12
-
13
-
14
-
15
-
16
-
17
-
18
-
19
-
20
-
21
-
22
-
23
-
24
-
25
-
26
-
27
-
28
-
29
-
30
-
31
-
32
-
33
-
34
-
35
-
36
-
37
-
38
-
39
-
40
-
41
-
42
-
43
-
44
-
45
-
46
-
47
-
48
-
49
-
50
-
51
-
52
-
53
-
54
-
55
-
56
-
57
-
58
-
59
-
60
-
61
-
62
-
63
-
64
-
65
-
66
-
67
-
68
-
69
-
70
-
71
-
72
-
73
-
74
-
75
-
76
-
77
-
78
-
79
-
80
-
81
-
82
-
83
-
84
-
85
-
86
-
87
-
88
-
89
-
90
-
91
-
92
-
93
-
 94
94 -
 95
95 -
 96
96 -
 97
97 -
 98
98 -
 99
99 -
 100
100 -
 101
101 -
 102
102 -
 103
103 -
 104
104 -
 105
105 -
 106
106 -
 107
107 -
 108
108 -
 109
109 -
 110
110 -
 111
111 -
 112
112 -
 113
113 -
 114
114 -
115
-
116
-
117
-
118
-
119
-
120
-
121
-
122
-
123
-
124
-
125
-
126
-
127
-
128
-
129
-
130
-
131
-
132
-
133
-
134
-
135
-
136
-
137
-
138
-
139
-
140
-
141
-
142
-
143
-
144
-
145
-
146
-
147
-
148
-
149
-
150
-
151
-
152
-
153
-
154
-
155
-
156
-
157
-
158
-
159
-
160
-
161
-
162
-
163
-
164
-
165
-
166
-
167
-
168
-
169
-
170
-
171
-
172
-
173
-
174
-
175
-
176
-
177
-
178
-
179
-
180
-
181
-
182
-
183
-
184
-
185
-
186
-
187
-
188
-
189
-
190
-
191
-
192
-
193
-
194
-
195
-
196
-
197
-
198
-
199
-
200
-
201
-
202
-
203
-
204
-
205
-
206
-
207
-
208
-
209
-
210
-
211
-
212
-
213
-
214
-
215
-
216
-
217
-
218
-
219
-
220
-
221
-
222
-
223
-
224
-
225
-
226
-
227
-
228
-
229
-
230
-
231
-
232
-
233
-
234
-
235
-
236
-
237
-
238
-
239
-
240
-
241
-
242
-
243
-
244
-
245
-
246
-
247
-
248
-
249
-
250
-
251
-
252
-
253
-
254
-
255
-
256
-
257
-
258
-
259
-
260
-
261
-
262
-
263
-
264
-
265
-
266
-
267
-
268
-
269
-
270
-
271
-
272
 |
 |

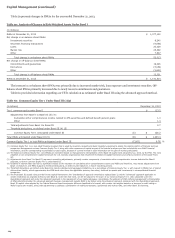
Capital Management (continued)
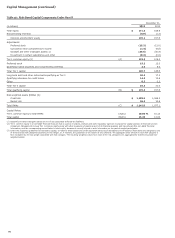
Table 56: Risk-Based Capital Components Under Basel I
December 31,
(in billions) 2013 2012
Total equity $ 171.0 158.9
Noncontrolling interests (0.9) (1.3)
Common stockholders' equity 170.1 157.6
Adjustments:
Preferred stock (15.2) (12.0)
Cumulative other comprehensive income (1.4) (5.6)
Goodwill and other intangible assets (1) (29.6) (30.4)
Investment in certain subsidiaries and other (0.4) (0.6)
Tier 1 common equity (2) (A) 123.5 109.0
Preferred stock 15.2 12.0
Qualifying hybrid securities and noncontrolling interests 2.0 5.6
Total Tier 1 capital 140.7 126.6
Long-term debt and other instruments qualifying as Tier 2 20.5 17.2
Qualifying allowance for credit losses 14.3 13.6
Other 0.7 0.2
Total Tier 2 capital 35.5 31.0
Total qualifying capital (B) $ 176.2 157.6
Risk-weighted assets (RWAs) (3):
Credit risk $ 1,105.2 1,066.2
Market risk 36.3 10.9
Total RWAs (C) $ 1,141.5 1,077.1
Capital Ratios:
Tier 1 common equity to total RWAs (A)/(C) 10.82 % 10.12
Total capital (B)/(C) 15.43 14.63
(1) Goodwill and other intangible assets are net of any associated deferred tax liabilities.
(2) Tier 1 common equity is a non-GAAP financial measure that is used by investors, analysts and bank regulatory agencies to assess the capital position of financial services
companies. Management reviews Tier 1 common equity along with other measures of capital as part of its financial analyses and has included this non-GAAP financial
information, and the corresponding reconciliation to total equity, because of current interest in such information on the part of market participants.
(3) Under the regulatory guidelines for risk-based capital, on-balance sheet assets and credit equivalent amounts of derivatives and off-balance sheet items are assigned to one
of several broad risk categories according to the obligor, or, if relevant, the guarantor or the nature of any collateral. The aggregate dollar amount in each risk category is
then multiplied by the risk weight associated with that category. The resulting weighted values from each of the risk categories are aggregated for determining total risk-
weighted assets.
102