Wells Fargo 2013 Annual Report Download - page 70
Download and view the complete annual report
Please find page 70 of the 2013 Wells Fargo annual report below. You can navigate through the pages in the report by either clicking on the pages listed below, or by using the keyword search tool below to find specific information within the annual report.-
 1
1 -
2
-
3
-
4
-
5
-
6
-
7
-
8
-
9
-
10
-
11
-
12
-
13
-
14
-
15
-
16
-
17
-
18
-
19
-
20
-
21
-
22
-
23
-
24
-
25
-
26
-
27
-
28
-
29
-
30
-
31
-
32
-
33
-
34
-
35
-
36
-
37
-
38
-
39
-
40
-
41
-
42
-
43
-
44
-
45
-
46
-
47
-
48
-
49
-
50
-
51
-
52
-
53
-
54
-
55
-
56
-
57
-
58
-
59
-
 60
60 -
 61
61 -
 62
62 -
 63
63 -
 64
64 -
 65
65 -
 66
66 -
 67
67 -
 68
68 -
 69
69 -
 70
70 -
 71
71 -
 72
72 -
 73
73 -
 74
74 -
 75
75 -
 76
76 -
 77
77 -
 78
78 -
 79
79 -
 80
80 -
81
-
82
-
83
-
84
-
85
-
86
-
87
-
88
-
89
-
90
-
91
-
92
-
93
-
94
-
95
-
96
-
97
-
98
-
99
-
100
-
101
-
102
-
103
-
104
-
105
-
106
-
107
-
108
-
109
-
110
-
111
-
112
-
113
-
114
-
115
-
116
-
117
-
118
-
119
-
120
-
121
-
122
-
123
-
124
-
125
-
126
-
127
-
128
-
129
-
130
-
131
-
132
-
133
-
134
-
135
-
136
-
137
-
138
-
139
-
140
-
141
-
142
-
143
-
144
-
145
-
146
-
147
-
148
-
149
-
150
-
151
-
152
-
153
-
154
-
155
-
156
-
157
-
158
-
159
-
160
-
161
-
162
-
163
-
164
-
165
-
166
-
167
-
168
-
169
-
170
-
171
-
172
-
173
-
174
-
175
-
176
-
177
-
178
-
179
-
180
-
181
-
182
-
183
-
184
-
185
-
186
-
187
-
188
-
189
-
190
-
191
-
192
-
193
-
194
-
195
-
196
-
197
-
198
-
199
-
200
-
201
-
202
-
203
-
204
-
205
-
206
-
207
-
208
-
209
-
210
-
211
-
212
-
213
-
214
-
215
-
216
-
217
-
218
-
219
-
220
-
221
-
222
-
223
-
224
-
225
-
226
-
227
-
228
-
229
-
230
-
231
-
232
-
233
-
234
-
235
-
236
-
237
-
238
-
239
-
240
-
241
-
242
-
243
-
244
-
245
-
246
-
247
-
248
-
249
-
250
-
251
-
252
-
253
-
254
-
255
-
256
-
257
-
258
-
259
-
260
-
261
-
262
-
263
-
264
-
265
-
266
-
267
-
268
-
269
-
270
-
271
-
272
 |
 |

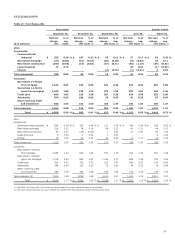
Risk Management – Credit Risk Management (continued)
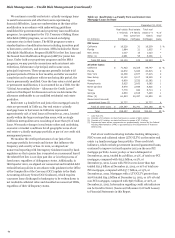
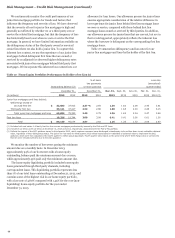
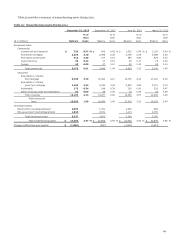
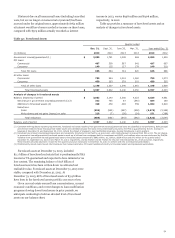
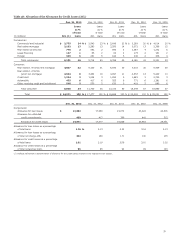
NONPERFORMING ASSETS (NONACCRUAL LOANS AND
Table 29 summarizes nonperforming
FORECLOSED ASSETS)
assets (NPAs) for each of the last five years. We generally place
loans on nonaccrual status when:
x the full and timely collection of interest or principal
becomes uncertain (generally based on an assessment of the
borrower’s financial condition and the adequacy of
collateral, if any);
x they are 90 days (120 days with respect to real estate 1-4
family first and junior lien mortgages) past due for interest
or principal, unless both well-secured and in the process of
collection;
x part of the principal balance has been charged off (including
loans discharged in bankruptcy);
x for junior lien mortgages, we have evidence that the related
first lien mortgage may be 120 days past due or in the
process of foreclosure regardless of the junior lien
delinquency status; or
x performing consumer loans are discharged in bankruptcy,
regardless of their delinquency status.
Note 1 (Summary of Significant Accounting Policies – Loans)
to Financial Statements in this Report describes our accounting
policy for nonaccrual and impaired loans.
Table 29: Nonperforming Assets (Nonaccrual Loans and Foreclosed Assets)
December 31,
(in millions) 2013 2012 2011 2010 2009
Nonaccrual loans:
Commercial:
Commercial and industrial $ 738 1,422 2,142 3,213 4,397
Real estate mortgage 2,252 3,322 4,085 5,227 3,696
Real estate construction 416 1,003 1,890 2,676 3,313
Lease financing 29 27 53 108 171
Foreign 40 50 47 127 146
Total commercial (1) 3,475 5,824 8,217 11,351 11,723
Consumer:
Real estate 1-4 family first mortgage (2) 9,799 11,455 10,913 12,289 10,100
Real estate 1-4 family junior lien mortgage 2,188 2,922 1,975 2,302 2,263
Automobile 173 245 159 244 270
Other revolving credit and installment 33 40 40 56 62
Total consumer (3) 12,193 14,662 13,087 14,891 12,695
Total nonaccrual loans (4)(5)(6) 15,668 20,486 21,304 26,242 24,418
As a percentage of total loans 1.90 % 2.56 2.77 3.47 3.12
Foreclosed assets:
Government insured/guaranteed (7) $ 2,093 1,509 1,319 1,479 960
Non-government insured/guaranteed 1,844 2,514 3,342 4,530 2,199
Total foreclosed assets 3,937 4,023 4,661 6,009 3,159
Total nonperforming assets $ 19,605 24,509 25,965 32,251 27,577
As a percentage of total loans 2.37 % 3.07 3.37 4.26 3.52
(1) Includes LHFS of $1 million, $16 million, $25 million, $3 million and $27 million at December 31, 2013, 2012, 2011, 2010, and 2009 respectively.
(2) Includes MHFS of $227 million, $336 million, $301 million, $426 million and $339 million at December 31, 2013, 2012, 2011, 2010, and 2009 respectively.
(3) December 31, 2012, includes the impact of the implementation of the Interagency and OCC Guidance issued in 2012.
(4) Excludes PCI loans because they continue to earn interest income from accretable yield, independent of performance in accordance with their contractual terms.
(5) Real estate 1-4 family mortgage loans predominantly insured by the FHA or guaranteed by the VA and student loans predominantly guaranteed by agencies on behalf of the
U.S. Department of Education under the Federal Family Education Loan Program are not placed on nonaccrual status because they are insured or guaranteed.
(6) See Note 6 (Loans and Allowance for Credit Losses) to Financial Statements in this Report for further information on impaired loans.
(7) Consistent with regulatory reporting requirements, foreclosed real estate resulting from government insured/guaranteed loans are classified as nonperforming. Both principal
and interest related to these foreclosed real estate assets are collectible because the loans were predominantly insured by the FHA or guaranteed by the VA. Increase in
balance at December 31, 2013, reflects the impact of changes to loan modification programs, slowing foreclosures earlier in the year.
68