Wells Fargo 2013 Annual Report Download - page 86
Download and view the complete annual report
Please find page 86 of the 2013 Wells Fargo annual report below. You can navigate through the pages in the report by either clicking on the pages listed below, or by using the keyword search tool below to find specific information within the annual report.-
 1
1 -
2
-
3
-
4
-
5
-
6
-
7
-
8
-
9
-
10
-
11
-
12
-
13
-
14
-
15
-
16
-
17
-
18
-
19
-
20
-
21
-
22
-
23
-
24
-
25
-
26
-
27
-
28
-
29
-
30
-
31
-
32
-
33
-
34
-
35
-
36
-
37
-
38
-
39
-
40
-
41
-
42
-
43
-
44
-
45
-
46
-
47
-
48
-
49
-
50
-
51
-
52
-
53
-
54
-
55
-
56
-
57
-
58
-
59
-
60
-
61
-
62
-
63
-
64
-
65
-
66
-
67
-
68
-
69
-
70
-
71
-
72
-
73
-
74
-
75
-
 76
76 -
 77
77 -
 78
78 -
 79
79 -
 80
80 -
 81
81 -
 82
82 -
 83
83 -
 84
84 -
 85
85 -
 86
86 -
 87
87 -
 88
88 -
 89
89 -
 90
90 -
 91
91 -
 92
92 -
 93
93 -
 94
94 -
 95
95 -
 96
96 -
97
-
98
-
99
-
100
-
101
-
102
-
103
-
104
-
105
-
106
-
107
-
108
-
109
-
110
-
111
-
112
-
113
-
114
-
115
-
116
-
117
-
118
-
119
-
120
-
121
-
122
-
123
-
124
-
125
-
126
-
127
-
128
-
129
-
130
-
131
-
132
-
133
-
134
-
135
-
136
-
137
-
138
-
139
-
140
-
141
-
142
-
143
-
144
-
145
-
146
-
147
-
148
-
149
-
150
-
151
-
152
-
153
-
154
-
155
-
156
-
157
-
158
-
159
-
160
-
161
-
162
-
163
-
164
-
165
-
166
-
167
-
168
-
169
-
170
-
171
-
172
-
173
-
174
-
175
-
176
-
177
-
178
-
179
-
180
-
181
-
182
-
183
-
184
-
185
-
186
-
187
-
188
-
189
-
190
-
191
-
192
-
193
-
194
-
195
-
196
-
197
-
198
-
199
-
200
-
201
-
202
-
203
-
204
-
205
-
206
-
207
-
208
-
209
-
210
-
211
-
212
-
213
-
214
-
215
-
216
-
217
-
218
-
219
-
220
-
221
-
222
-
223
-
224
-
225
-
226
-
227
-
228
-
229
-
230
-
231
-
232
-
233
-
234
-
235
-
236
-
237
-
238
-
239
-
240
-
241
-
242
-
243
-
244
-
245
-
246
-
247
-
248
-
249
-
250
-
251
-
252
-
253
-
254
-
255
-
256
-
257
-
258
-
259
-
260
-
261
-
262
-
263
-
264
-
265
-
266
-
267
-
268
-
269
-
270
-
271
-
272
 |
 |
Asset/Liability Management
Asset/liability management involves evaluating, monitoring and
managing interest rate risk, market risk, liquidity and funding.
Primary oversight of these risks resides with the Finance
Committee of our Board of Directors (Board), which oversees the
administration and effectiveness of financial risk management
policies and processes used to assess and manage these risks. At
the management level we utilize a Corporate Asset/Liability
Management Committee (Corporate ALCO), which consists of
senior financial and business executives, to oversee these risks
and report on them periodically to the Board’s Finance
Committee. Each of our principal lines of business has its own
asset/liability management committee and process linked to the
Corporate ALCO process. As discussed in more detail for trading
activities below, we employ separate management level oversight
specific to the market risks related to our trading activities.
Market risk, in its broadest sense, refers to the possibility that
losses will result from the impact of adverse changes in market
rates and prices on our trading and non-trading portfolios and
financial instruments.
INTEREST RATE RISK Interest rate risk, which potentially can
have a significant earnings impact, is an integral part of being a
financial intermediary. We are subject to interest rate risk
because:
x
x
x
x
x
assets and liabilities may mature or reprice at different
times (for example, if assets reprice faster than liabilities
and interest rates are generally falling, earnings will initially
decline);
assets and liabilities may reprice at the same time but by
different amounts (for example, when the general level of
interest rates is falling, we may reduce rates paid on
checking and savings deposit accounts by an amount that is
less than the general decline in market interest rates);
short-term and long-term market interest rates may change
by different amounts (for example, the shape of the yield
curve may affect new loan yields and funding costs
differently);
the remaining maturity of various assets or liabilities may
shorten or lengthen as interest rates change (for example, if
long-term mortgage interest rates decline sharply, MBS held
in the investment securities portfolio may prepay
significantly earlier than anticipated, which could reduce
portfolio income); or
interest rates may also have a direct or indirect effect on
loan demand, collateral values, credit losses, mortgage
origination volume, the fair value of MSRs and other
financial instruments, the value of the pension liability and
other items affecting earnings.
We assess interest rate risk by comparing outcomes under
various earnings simulations using many interest rate scenarios
that differ in the direction of interest rate changes, the degree of
change over time, the speed of change and the projected shape of
the yield curve. These simulations require assumptions
regarding how changes in interest rates and related market
conditions could influence drivers of earnings and balance sheet
composition such as loan origination demand, prepayment
speeds, deposit balances and mix, as well as pricing strategies.
Our risk measures include both net interest income
sensitivity and interest rate sensitive noninterest income and
expense impacts. We refer to the combination of these exposures
as interest rate sensitive earnings. In general, the Company is
positioned to benefit from higher interest rates. Currently, our
profile is such that net interest income will benefit from higher
interest rates as our assets reprice faster and to a greater degree
than our liabilities, and, in response to lower market rates, our
assets will reprice downward and to a greater degree than our
liabilities. Our interest rate sensitive noninterest income and
expense is largely driven by mortgage activity, and tends to move
in the opposite direction of our net interest income. So, in
response to higher interest rates, mortgage activity, primarily
refinancing activity, generally declines. And in response to lower
rates, mortgage activity generally increases. Mortgage results are
also impacted by the valuation of MSRs and related hedge
positions. See the “Risk Management – Mortgage Banking
Interest Rate and Market Risk” section in this Report for more
information.
The degree to which these sensitivities offset each other is
dependent upon the timing and magnitude of changes in interest
rates, and the slope of the yield curve. During a transition to a
higher or lower interest rate environment, a reduction or
increase in interest-sensitive earnings from the mortgage
banking business could occur quickly, while the benefit or
detriment from balance sheet repricing could take more time to
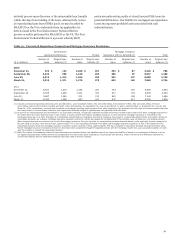
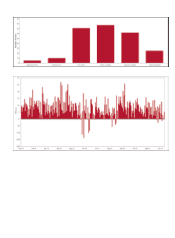
develop. For example, our lower rate scenarios (scenario 1 and
scenario 2) in the following table initially measure a decline in
long-term interest rates versus our most likely scenario.
Although the performance in both lower rate scenarios contains
initial benefit from increased mortgage banking activity, each
results in lower earnings relative to the most likely scenario over
time given pressure on net interest income. The higher rate
scenarios (scenario 3 and scenario 4) measure the impact of
varying degrees of rising short-term and long-term interest rates
over the course of the forecast horizon relative to the most likely
scenario, both resulting in positive earnings sensitivity.
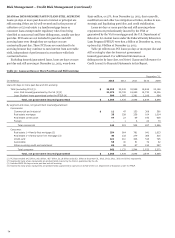
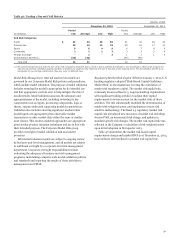
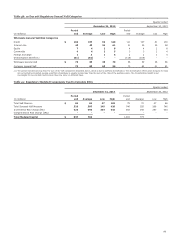
As of December 31, 2013, our most recent simulations
estimate earnings at risk over the next 24 months under a range
of both lower and higher interest rates. The results of the
simulations are summarized in Table 42, indicating cumulative
net income after tax earnings sensitivity relative to the most
likely earnings plan over the 24 month horizon (a positive range
indicates a beneficial earnings sensitivity measurement relative
to the most likely earnings plan).
84