Wells Fargo 2013 Annual Report Download - page 94
Download and view the complete annual report
Please find page 94 of the 2013 Wells Fargo annual report below. You can navigate through the pages in the report by either clicking on the pages listed below, or by using the keyword search tool below to find specific information within the annual report.-
 1
1 -
2
-
3
-
4
-
5
-
6
-
7
-
8
-
9
-
10
-
11
-
12
-
13
-
14
-
15
-
16
-
17
-
18
-
19
-
20
-
21
-
22
-
23
-
24
-
25
-
26
-
27
-
28
-
29
-
30
-
31
-
32
-
33
-
34
-
35
-
36
-
37
-
38
-
39
-
40
-
41
-
42
-
43
-
44
-
45
-
46
-
47
-
48
-
49
-
50
-
51
-
52
-
53
-
54
-
55
-
56
-
57
-
58
-
59
-
60
-
61
-
62
-
63
-
64
-
65
-
66
-
67
-
68
-
69
-
70
-
71
-
72
-
73
-
74
-
75
-
76
-
77
-
78
-
79
-
80
-
81
-
82
-
83
-
 84
84 -
 85
85 -
 86
86 -
 87
87 -
 88
88 -
 89
89 -
 90
90 -
 91
91 -
 92
92 -
 93
93 -
 94
94 -
 95
95 -
 96
96 -
 97
97 -
 98
98 -
 99
99 -
 100
100 -
 101
101 -
 102
102 -
 103
103 -
 104
104 -
105
-
106
-
107
-
108
-
109
-
110
-
111
-
112
-
113
-
114
-
115
-
116
-
117
-
118
-
119
-
120
-
121
-
122
-
123
-
124
-
125
-
126
-
127
-
128
-
129
-
130
-
131
-
132
-
133
-
134
-
135
-
136
-
137
-
138
-
139
-
140
-
141
-
142
-
143
-
144
-
145
-
146
-
147
-
148
-
149
-
150
-
151
-
152
-
153
-
154
-
155
-
156
-
157
-
158
-
159
-
160
-
161
-
162
-
163
-
164
-
165
-
166
-
167
-
168
-
169
-
170
-
171
-
172
-
173
-
174
-
175
-
176
-
177
-
178
-
179
-
180
-
181
-
182
-
183
-
184
-
185
-
186
-
187
-
188
-
189
-
190
-
191
-
192
-
193
-
194
-
195
-
196
-
197
-
198
-
199
-
200
-
201
-
202
-
203
-
204
-
205
-
206
-
207
-
208
-
209
-
210
-
211
-
212
-
213
-
214
-
215
-
216
-
217
-
218
-
219
-
220
-
221
-
222
-
223
-
224
-
225
-
226
-
227
-
228
-
229
-
230
-
231
-
232
-
233
-
234
-
235
-
236
-
237
-
238
-
239
-
240
-
241
-
242
-
243
-
244
-
245
-
246
-
247
-
248
-
249
-
250
-
251
-
252
-
253
-
254
-
255
-
256
-
257
-
258
-
259
-
260
-
261
-
262
-
263
-
264
-
265
-
266
-
267
-
268
-
269
-
270
-
271
-
272
 |
 |

Risk Management – Asset/Liability Management (continued)
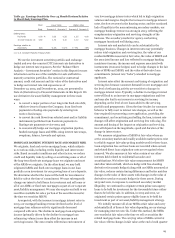
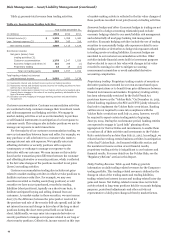
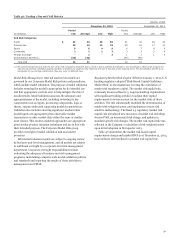
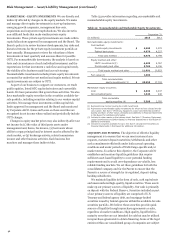
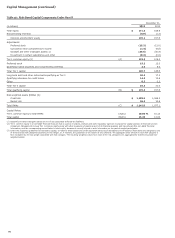
Table 47: Market Risk Regulatory Capital and RWA
December 31, 2013
(in millions)
Risk-
based
capital
Risk-
weighted
assets
Total VaR Measure $ 252 3,149
Total Stressed VaR Measure 921 11,512
Incremental Risk Charge (IRC) 393 4,913
Total Modeled Capital (1) 1,566 19,574
Comprehensive Risk Charge (CRC) - -
Standard Specific Risk Charge:
Securitized Charge 633 7,913
Non-securitized Charge 583 7,289
Total Standard Specific Risk Charge 1,216 15,202
De minimus Charges 125 1,563
Total $ 2,907 36,339
(1) Includes the capital multiplier.
Composition of Material Portfolio of Covered Positions The
Basel 2.5 market risk capital rule substantially modified the
determination of market RWA, and implemented a more risk
sensitive methodology for the risks inherent in certain “covered”
trading positions. The positions that are “covered” by the market
risk capital rule are generally a subset of our trading assets and
trading liabilities, specifically those held by the Company for the
purpose of short-term resale or with the intent of benefiting
from actual or expected short-term price movements, or to lock
in arbitrage profits.
The material portfolio of the Company’s “covered” positions
is predominantly concentrated in the trading assets and trading
liabilities managed within Wholesale Banking, which is the
predominant contributor to the Company’s overall VaR.
Wholesale Banking engages in the fixed income, traded credit,
foreign exchange, equities, and commodities markets businesses.
Regulatory Market Risk Capital Components The Company’s
“covered’ positions are subject to the market risk capital
requirements, which are based on internally developed models
or standardized specific risk charges. The market risk regulatory
capital models are subject to internal model risk management
and validation. The models are continuously monitored and
enhanced in response to changes in market conditions,
improvements in system capabilities, and changes in the
Company’s market risk exposure. The Company is required to
obtain and has received prior written approval from its
regulators before using its internally developed models to
calculate the market risk capital charge.
Basel 2.5 prescribes various VaR measures (e.g., Total VaR
Measure) in the determination of regulatory capital and risk-
weighted assets. The Company uses the same VaR models for
both market risk management purposes as well as regulatory
capital calculations.
Regulatory VaR The Regulatory VaR measures include:
Total VaR Measure – is composed of General VaR and
Specific Risk VaR and uses the previous 12 months of
historical market data to comply with regulatory
requirements.
General VaR
Measures the risk of broad market movements
such as changes in the level of interest rates, credit
spreads, equity prices, foreign exchange rates, and
commodity prices.
Uses historical simulation analysis based on 99%
confidence level and a 10-day time horizon.
Specific Risk VaR
Measures the risk of loss that could result from
factors other than broad market movement or
name specific market risk.
Uses Monte Carlo simulation analysis based on a
99% confidence level and a 10-day time horizon.
Total Stressed VaR Measure – uses a historical period of
significant financial stress over a continuous 12 month
period using historically available market data and is
composed of General Stressed VaR and Specific Risk
Stressed VaR. Stressed VaR uses the same methodology and
models as the Total VaR measure.
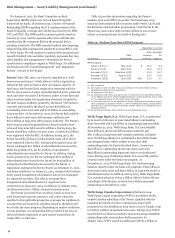
Incremental Risk Charge An Incremental Risk model, according
to the market risk capital rule, must capture losses due to both
issuer default and migration risk at the 99.9% confidence level
over the one-year capital horizon under the assumption of
constant level of risk or a constant position assumption. The
model covers all credit-sensitive non-securitized products.
The Company calculates Incremental Risk by generating a
portfolio loss distribution utilizing Monte Carlo simulation,
which assumes numerous scenarios, where an assumption is
made that the portfolio’s composition remains constant for a
one-year time horizon. That is, the model will utilize a constant
positions assumption. Individual issuer credit grade migration
and issuer default risk is modeled through generation of the
issuer’s credit rating transition based upon statistical modeling.
Correlation between credit grade migration and default is
captured by a multifactor proprietary model which takes into
account industry classifications as well as regional effects.
Additionally, the impact of market and issuer specific
concentrations is reflected in the modeling framework by
assignment of a higher charge for portfolios that have increasing
concentrations in particular issuers or sectors. Lastly, the model
captures product basis risk; that is, it reflects the material
disparity between a position and its hedge.
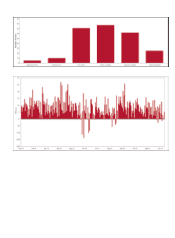
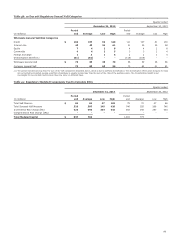
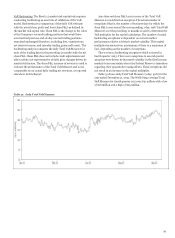
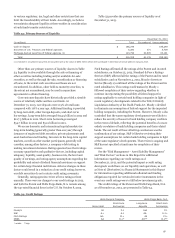
Table 48 shows the General VaR measure categorized by
major risk categories. Table 49 shows the results of the
Company’s modeled components for regulatory capital
calculations. As presented in Table 48, average 10-day General
VaR was $80 million for the quarter ended December 31, 2013,
compared with $64 million for the quarter ended
September 30, 2013. The increase was primarily driven by
changes in portfolio composition.
x
x
o
o
92