Wells Fargo 2013 Annual Report Download - page 48
Download and view the complete annual report
Please find page 48 of the 2013 Wells Fargo annual report below. You can navigate through the pages in the report by either clicking on the pages listed below, or by using the keyword search tool below to find specific information within the annual report.-
 1
1 -
2
-
3
-
4
-
5
-
6
-
7
-
8
-
9
-
10
-
11
-
12
-
13
-
14
-
15
-
16
-
17
-
18
-
19
-
20
-
21
-
22
-
23
-
24
-
25
-
26
-
27
-
28
-
29
-
30
-
31
-
32
-
33
-
34
-
35
-
36
-
37
-
 38
38 -
 39
39 -
 40
40 -
 41
41 -
 42
42 -
 43
43 -
 44
44 -
 45
45 -
 46
46 -
 47
47 -
 48
48 -
 49
49 -
 50
50 -
 51
51 -
 52
52 -
 53
53 -
 54
54 -
 55
55 -
 56
56 -
 57
57 -
 58
58 -
59
-
60
-
61
-
62
-
63
-
64
-
65
-
66
-
67
-
68
-
69
-
70
-
71
-
72
-
73
-
74
-
75
-
76
-
77
-
78
-
79
-
80
-
81
-
82
-
83
-
84
-
85
-
86
-
87
-
88
-
89
-
90
-
91
-
92
-
93
-
94
-
95
-
96
-
97
-
98
-
99
-
100
-
101
-
102
-
103
-
104
-
105
-
106
-
107
-
108
-
109
-
110
-
111
-
112
-
113
-
114
-
115
-
116
-
117
-
118
-
119
-
120
-
121
-
122
-
123
-
124
-
125
-
126
-
127
-
128
-
129
-
130
-
131
-
132
-
133
-
134
-
135
-
136
-
137
-
138
-
139
-
140
-
141
-
142
-
143
-
144
-
145
-
146
-
147
-
148
-
149
-
150
-
151
-
152
-
153
-
154
-
155
-
156
-
157
-
158
-
159
-
160
-
161
-
162
-
163
-
164
-
165
-
166
-
167
-
168
-
169
-
170
-
171
-
172
-
173
-
174
-
175
-
176
-
177
-
178
-
179
-
180
-
181
-
182
-
183
-
184
-
185
-
186
-
187
-
188
-
189
-
190
-
191
-
192
-
193
-
194
-
195
-
196
-
197
-
198
-
199
-
200
-
201
-
202
-
203
-
204
-
205
-
206
-
207
-
208
-
209
-
210
-
211
-
212
-
213
-
214
-
215
-
216
-
217
-
218
-
219
-
220
-
221
-
222
-
223
-
224
-
225
-
226
-
227
-
228
-
229
-
230
-
231
-
232
-
233
-
234
-
235
-
236
-
237
-
238
-
239
-
240
-
241
-
242
-
243
-
244
-
245
-
246
-
247
-
248
-
249
-
250
-
251
-
252
-
253
-
254
-
255
-
256
-
257
-
258
-
259
-
260
-
261
-
262
-
263
-
264
-
265
-
266
-
267
-
268
-
269
-
270
-
271
-
272
 |
 |

Earnings Performance (continued)
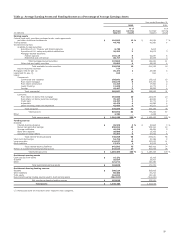
driven by lower net charge-offs and continued improvement in
credit quality.
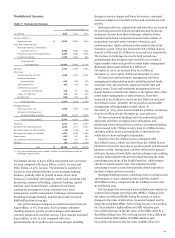
Balance Sheet Analysis
At December 31, 2013, our assets totaled $1.5 trillion, up
$104.0 billion from December 31, 2012. The predominant areas
of asset growth were in federal funds sold and other short-term
investments, which increased $76.5 billion, investment
securities, which increased $29.2 billion, and loans, which
increased $26.2 billion, partially offset by a $30.4 billion
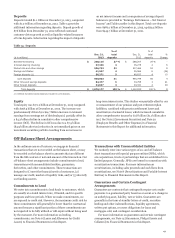
decrease in mortgages held for sale. Deposit growth of
$76.3 billion, total equity growth of $12.1 billion and an increase
in long-term debt of $25.6 billion from December 31, 2012 were
the predominant sources funding our asset growth during 2013.
The deposit growth resulted in an increase in the proportion of
interest-bearing deposits. Equity growth benefited from
$14.7 billion in earnings net of dividends paid, as well as from
the issuance of preferred stock. The strength of our business
model produced record earnings and continued internal capital
generation as reflected in our capital ratios, all of which
improved from December 31, 2012. Tier 1 capital as a percentage
of total risk-weighted assets increased to 12.33%, total capital
increased to 15.43%, Tier 1 leverage increased to 9.60%, and
Tier 1 common equity increased to 10.82% at December 31,
2013, compared with 11.75%, 14.63%, 9.47%, and 10.12%,
respectively, at December 31, 2012.
The following discussion provides additional information
about the major components of our balance sheet. Information
regarding our capital and changes in our asset mix is included in
the “Earnings Performance – Net Interest Income” and “Capital
Management” sections and Note 26 (Regulatory and Agency
Capital Requirements) to Financial Statements in this Report.
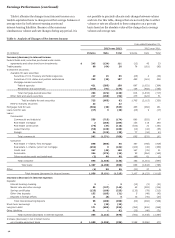
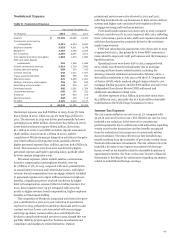
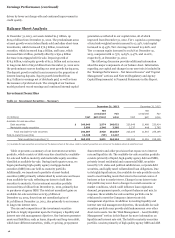
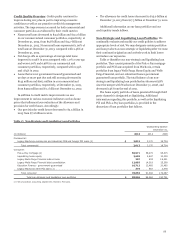
Investment Securities
Table 10: Investment Securities – Summary
December 31, 2013 December 31, 2012
(in millions) Cost
Net
unrealized
gain (loss)
Fair
value Cost
Net
unrealized
gain
Fair
value
Available-for-sale securities:
Debt securities $ 246,048 2,574 248,622 220,946 11,468 232,414
Marketable equity securities 2,039 1,346 3,385 2,337 448 2,785
Total available-for-sale securities 248,087 3,920 252,007 223,283 11,916 235,199
Held-to-maturity securities 12,346 (99) 12,247 - - -
Total investment securities (1) $ 260,433 3,821 264,254 223,283 11,916 235,199
(1) Available-for-sale securities are carried on the balance sheet at fair value. Held-to-maturity securities are carried on the balance sheet at amortized cost.
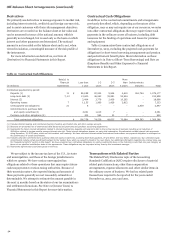
Table 10 presents a summary of our investment securities
portfolio, which consists of debt securities classified as available-
for-sale and held-to-maturity and marketable equity securities
classified as available-for-sale. During fourth quarter 2013, we
began purchasing high-quality agency mortgage-backed
securities (MBS) into our held-to-maturity portfolio.
Additionally, we transferred a portfolio of asset-backed
securities (ABS) primarily collateralized by auto loans and leases
from available-for-sale, reflecting our intent to hold these
securities to maturity. Our investment securities portfolio
increased $29.2 billion from December 31, 2012, primarily due
to purchases of agency MBS. The total net unrealized gains on
available-for-sale securities were $3.9 billion at
December 31, 2013, down from net unrealized gains of
$11.9 billion at December 31, 2012, due primarily to an increase
in long-term interest rates.
The size and composition of the investment securities
portfolio is largely dependent upon the Company’s liquidity and
interest rate risk management objectives. Our business generates
assets and liabilities, such as loans, deposits and long-term debt,
which have different maturities, yields, re-pricing, prepayment
characteristics and other provisions that expose us to interest
rate and liquidity risk. The available-for-sale securities portfolio
consists primarily of liquid, high quality agency debt and MBS,
privately issued residential and commercial MBS, securities
issued by U.S. states and political subdivisions, corporate debt
securities, and highly rated collateralized loan obligations. Due
to its highly liquid nature, the available-for-sale portfolio can be
used to meet funding needs that arise in the normal course of
business or due to market stress. Changes in our interest rate
risk profile may occur due to changes in overall economic or
market conditions, which could influence loan origination
demand, prepayment speeds, or deposit balances and mix. In
response, the available-for-sale securities portfolio can be
rebalanced to meet the Company’s interest rate risk
management objectives. In addition to meeting liquidity and
interest rate risk management objectives, the available-for-sale
securities portfolio may provide yield enhancement over other
short-term assets. See the “Risk Management – Asset/Liability
Management” section in this Report for more information on
liquidity and interest rate risk. The held-to-maturity securities
portfolio consists primarily of high quality agency MBS and ABS
46