Wells Fargo 2013 Annual Report Download - page 72
Download and view the complete annual report
Please find page 72 of the 2013 Wells Fargo annual report below. You can navigate through the pages in the report by either clicking on the pages listed below, or by using the keyword search tool below to find specific information within the annual report.-
 1
1 -
2
-
3
-
4
-
5
-
6
-
7
-
8
-
9
-
10
-
11
-
12
-
13
-
14
-
15
-
16
-
17
-
18
-
19
-
20
-
21
-
22
-
23
-
24
-
25
-
26
-
27
-
28
-
29
-
30
-
31
-
32
-
33
-
34
-
35
-
36
-
37
-
38
-
39
-
40
-
41
-
42
-
43
-
44
-
45
-
46
-
47
-
48
-
49
-
50
-
51
-
52
-
53
-
54
-
55
-
56
-
57
-
58
-
59
-
60
-
61
-
 62
62 -
 63
63 -
 64
64 -
 65
65 -
 66
66 -
 67
67 -
 68
68 -
 69
69 -
 70
70 -
 71
71 -
 72
72 -
 73
73 -
 74
74 -
 75
75 -
 76
76 -
 77
77 -
 78
78 -
 79
79 -
 80
80 -
 81
81 -
 82
82 -
83
-
84
-
85
-
86
-
87
-
88
-
89
-
90
-
91
-
92
-
93
-
94
-
95
-
96
-
97
-
98
-
99
-
100
-
101
-
102
-
103
-
104
-
105
-
106
-
107
-
108
-
109
-
110
-
111
-
112
-
113
-
114
-
115
-
116
-
117
-
118
-
119
-
120
-
121
-
122
-
123
-
124
-
125
-
126
-
127
-
128
-
129
-
130
-
131
-
132
-
133
-
134
-
135
-
136
-
137
-
138
-
139
-
140
-
141
-
142
-
143
-
144
-
145
-
146
-
147
-
148
-
149
-
150
-
151
-
152
-
153
-
154
-
155
-
156
-
157
-
158
-
159
-
160
-
161
-
162
-
163
-
164
-
165
-
166
-
167
-
168
-
169
-
170
-
171
-
172
-
173
-
174
-
175
-
176
-
177
-
178
-
179
-
180
-
181
-
182
-
183
-
184
-
185
-
186
-
187
-
188
-
189
-
190
-
191
-
192
-
193
-
194
-
195
-
196
-
197
-
198
-
199
-
200
-
201
-
202
-
203
-
204
-
205
-
206
-
207
-
208
-
209
-
210
-
211
-
212
-
213
-
214
-
215
-
216
-
217
-
218
-
219
-
220
-
221
-
222
-
223
-
224
-
225
-
226
-
227
-
228
-
229
-
230
-
231
-
232
-
233
-
234
-
235
-
236
-
237
-
238
-
239
-
240
-
241
-
242
-
243
-
244
-
245
-
246
-
247
-
248
-
249
-
250
-
251
-
252
-
253
-
254
-
255
-
256
-
257
-
258
-
259
-
260
-
261
-
262
-
263
-
264
-
265
-
266
-
267
-
268
-
269
-
270
-
271
-
272
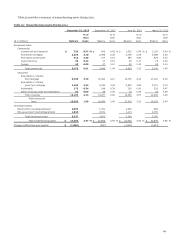
 |
 |

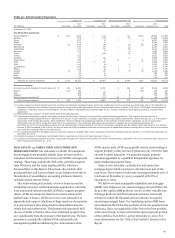
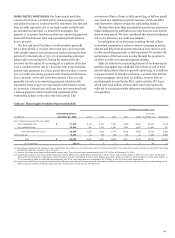
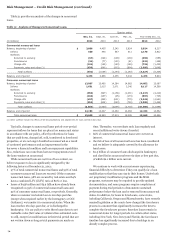
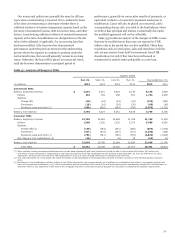
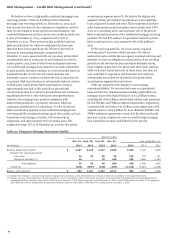
Risk Management – Credit Risk Management (continued)
Table 31 provides an analysis of the changes in nonaccrual
loans.
Table 31: Analysis of Changes in Nonaccrual Loans
Quarter ended
Dec. 31, Sept. 30, June 30, Mar. 31, Year ended Dec. 31,
(in millions) 2013 2013 2013 2013 2013 2012
Commercial nonaccrual loans
Balance, beginning of period $ 3,886 4,455 5,242 5,824 5,824 8,217
Inflows 520 490 557 611 2,178 3,812
Outflows:
Returned to accruing (67) (192) (128) (109) (496) (655)
Foreclosures (34) (77) (120) (91) (322) (469)
Charge-offs (191) (150) (193) (189) (723) (1,435)
Payments, sales and other (1) (639) (640) (903) (804) (2,986) (3,646)
Total outflows (931) (1,059) (1,344) (1,193) (4,527) (6,205)
Balance, end of period 3,475 3,886 4,455 5,242 3,475 5,824
Consumer nonaccrual loans
Balance, beginning of period 13,007 13,460 14,284 14,662 14,662 13,087
Inflows 1,691 2,015 2,071 2,340 8,117 14,569
Outflows:
Returned to accruing (953) (997) (1,156) (1,031) (4,137) (4,219)
Foreclosures (162) (167) (95) (173) (597) (745)
Charge-offs (437) (480) (651) (775) (2,343) (4,541)
Payments, sales and other (1) (953) (824) (993) (739) (3,509) (3,489)
Total outflows (2,505) (2,468) (2,895) (2,718) (10,586) (12,994)
Balance, end of period 12,193 13,007 13,460 14,284 12,193 14,662
Total nonaccrual loans $ 15,668 16,893 17,915 19,526 15,668 20,486
(1) Other outflows include the effects of VIE deconsolidations and adjustments for loans carried at fair value.
Typically, changes to nonaccrual loans period-over-period
represent inflows for loans that are placed on nonaccrual status
in accordance with our policy, offset by reductions for loans
that are paid down, charged off, sold, transferred to foreclosed
properties, or are no longer classified as nonaccrual as a result
of continued performance and an improvement in the
borrower’s financial condition and loan repayment capabilities.
Also, reductions can come from borrower repayments even if
the loan remains on nonaccrual.
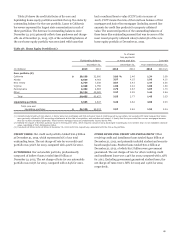
While nonaccrual loans are not free of loss content, we
believe exposure to loss is significantly mitigated by the
following factors at December 31, 2013:
x 97% of total commercial nonaccrual loans and 99% of total
consumer nonaccrual loans are secured. Of the consumer
nonaccrual loans, 98% are secured by real estate and 64%
have a combined LTV (CLTV) ratio of 80% or less.
x losses of $938 million and $3.9 billion have already been
recognized on 35% of commercial nonaccrual loans and
52% of consumer nonaccrual loans, respectively. Generally,
when a consumer real estate loan is 120 days past due
(except when required earlier by the Interagency or OCC
Guidance), we transfer it to nonaccrual status. When the
loan reaches 180 days past due, or is discharged in
bankruptcy, it is our policy to write these loans down to net
realizable value (fair value of collateral less estimated costs
to sell), except for modifications in their trial period that are
not written down as long as trial payments are made on
time. Thereafter, we reevaluate each loan regularly and
record additional write-downs if needed.
x 66% of commercial nonaccrual loans were current on
interest.
x the risk of loss of all nonaccrual loans has been considered
and we believe is adequately covered by the allowance for
loan losses.
x $2.3 billion of consumer loans discharged in bankruptcy
and classified as nonaccrual were 60 days or less past due,
of which $2.1 billion were current.
We continue to work with our customers experiencing
financial difficulty to determine if they can qualify for a loan
modification so that they can stay in their homes. Under both
our proprietary modification programs and the MHA
programs, customers may be required to provide updated
documentation, and some programs require completion of
payment during trial periods to demonstrate sustained
performance before the loan can be removed from nonaccrual
status. In addition, for loans in foreclosure, some states,
including California, Oregon and Massachusetts, have recently
enacted legislation or the courts have changed the foreclosure
process in a manner that significantly increases the time to
complete the foreclosure process; therefore loans remain in
nonaccrual status for longer periods. In certain other states,
including New York, New Jersey and Florida, the foreclosure
timeline has significantly increased due to backlogs in an
already complex process.
70