Wells Fargo 2013 Annual Report Download - page 254
Download and view the complete annual report
Please find page 254 of the 2013 Wells Fargo annual report below. You can navigate through the pages in the report by either clicking on the pages listed below, or by using the keyword search tool below to find specific information within the annual report.-
 1
1 -
2
-
3
-
4
-
5
-
6
-
7
-
8
-
9
-
10
-
11
-
12
-
13
-
14
-
15
-
16
-
17
-
18
-
19
-
20
-
21
-
22
-
23
-
24
-
25
-
26
-
27
-
28
-
29
-
30
-
31
-
32
-
33
-
34
-
35
-
36
-
37
-
38
-
39
-
40
-
41
-
42
-
43
-
44
-
45
-
46
-
47
-
48
-
49
-
50
-
51
-
52
-
53
-
54
-
55
-
56
-
57
-
58
-
59
-
60
-
61
-
62
-
63
-
64
-
65
-
66
-
67
-
68
-
69
-
70
-
71
-
72
-
73
-
74
-
75
-
76
-
77
-
78
-
79
-
80
-
81
-
82
-
83
-
84
-
85
-
86
-
87
-
88
-
89
-
90
-
91
-
92
-
93
-
94
-
95
-
96
-
97
-
98
-
99
-
100
-
101
-
102
-
103
-
104
-
105
-
106
-
107
-
108
-
109
-
110
-
111
-
112
-
113
-
114
-
115
-
116
-
117
-
118
-
119
-
120
-
121
-
122
-
123
-
124
-
125
-
126
-
127
-
128
-
129
-
130
-
131
-
132
-
133
-
134
-
135
-
136
-
137
-
138
-
139
-
140
-
141
-
142
-
143
-
144
-
145
-
146
-
147
-
148
-
149
-
150
-
151
-
152
-
153
-
154
-
155
-
156
-
157
-
158
-
159
-
160
-
161
-
162
-
163
-
164
-
165
-
166
-
167
-
168
-
169
-
170
-
171
-
172
-
173
-
174
-
175
-
176
-
177
-
178
-
179
-
180
-
181
-
182
-
183
-
184
-
185
-
186
-
187
-
188
-
189
-
190
-
191
-
192
-
193
-
194
-
195
-
196
-
197
-
198
-
199
-
200
-
201
-
202
-
203
-
204
-
205
-
206
-
207
-
208
-
209
-
210
-
211
-
212
-
213
-
214
-
215
-
216
-
217
-
218
-
219
-
220
-
221
-
222
-
223
-
224
-
225
-
226
-
227
-
228
-
229
-
230
-
231
-
232
-
233
-
234
-
235
-
236
-
237
-
238
-
239
-
240
-
241
-
242
-
243
-
 244
244 -
 245
245 -
 246
246 -
 247
247 -
 248
248 -
 249
249 -
 250
250 -
 251
251 -
 252
252 -
 253
253 -
 254
254 -
 255
255 -
 256
256 -
 257
257 -
 258
258 -
 259
259 -
 260
260 -
 261
261 -
 262
262 -
 263
263 -
 264
264 -
265
-
266
-
267
-
268
-
269
-
270
-
271
-
272
 |
 |

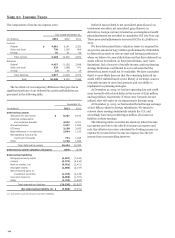
Note 21: Income Taxes
The components of income tax expense were:
Year ended December 31,
(in millions) 2013 2012 2011
Current:
Federal $ 4,601 9,141 3,352
State and local 736 1,198 468
Foreign 91 61 52
Total current 5,428 10,400 3,872
Deferred:
Federal 4,457 (1,151) 3,088
State and local 522 (166) 471
Foreign (2) 20 14
Total deferred 4,977 (1,297) 3,573
Total $ 10,405 9,103 7,445
The tax effects of our temporary differences that gave rise to
significant portions of our deferred tax assets and liabilities are
presented in the following table.
December 31,
(in millions) 2013 2012
Deferred tax assets
Allowance for loan losses $ 5,227 6,192
Deferred compensation
and employee benefits 4,283 4,701
Accrued expenses 1,247 1,692
PCI loans 2,150 2,692
Basis difference in investments 1,084 1,182
Net operating loss and tax
credit carry forwards 773 1,058
Other 1,720 1,868
Total deferred tax assets 16,484 19,385
Deferred tax assets valuation allowance (457) (579)
Deferred tax liabilities
Mortgage servicing rights (6,657) (7,360)
Leasing (4,274) (4,414)
Mark to market, net (5,761) (2,401)
Intangible assets (1,885) (2,157)
Net unrealized gains on
investment securities (1,155) (4,135)
Insurance reserves (2,068) (1,707)
Other (1,733) (1,683)
Total deferred tax liabilities (23,533) (23,857)
Net deferred tax liability (1) $ (7,506) (5,051)
(1) Included in accrued expenses and other liabilities.
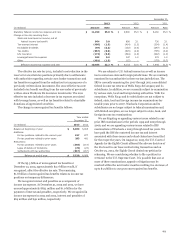
Deferred taxes related to net unrealized gains (losses) on
investment securities, net unrealized gains (losses) on
derivatives, foreign currency translation, and employee benefit
plan adjustments are recorded in cumulative OCI (see Note 23).
These associated adjustments increased OCI by $2.5 billion in
2013.
We have determined that a valuation reserve is required for
2013 in the amount of $457 million predominantly attributable
to deferred tax assets in various state and foreign jurisdictions
where we believe it is more likely than not that these deferred tax
assets will not be realized. In these jurisdictions, carry back
limitations, lack of sources of taxable income, and tax planning
strategy limitations contributed to our conclusion that the
deferred tax assets would not be realizable. We have concluded
that it is more likely than not that the remaining deferred tax
assets will be realized based on our history of earnings, sources
of taxable income in carry back periods, and our ability to
implement tax planning strategies.
At December 31, 2013, we had net operating loss and credit
carry forwards with related deferred tax assets of $730 million
and $43 million, respectively. If these carry forwards are not
utilized, they will expire in varying amounts through 2033.
At December 31, 2013, we had undistributed foreign earnings
of $1.6 billion related to foreign subsidiaries. We intend to
reinvest these earnings indefinitely outside the U.S. and
accordingly have not provided $450 million of income tax
liability on these earnings.
The following table reconciles the statutory federal income
tax expense and rate to the effective income tax expense and
rate. Our effective tax rate is calculated by dividing income tax
expense by income before income tax expense less the net
income from noncontrolling interests.
252