Wells Fargo 2013 Annual Report Download - page 71
Download and view the complete annual report
Please find page 71 of the 2013 Wells Fargo annual report below. You can navigate through the pages in the report by either clicking on the pages listed below, or by using the keyword search tool below to find specific information within the annual report.-
 1
1 -
2
-
3
-
4
-
5
-
6
-
7
-
8
-
9
-
10
-
11
-
12
-
13
-
14
-
15
-
16
-
17
-
18
-
19
-
20
-
21
-
22
-
23
-
24
-
25
-
26
-
27
-
28
-
29
-
30
-
31
-
32
-
33
-
34
-
35
-
36
-
37
-
38
-
39
-
40
-
41
-
42
-
43
-
44
-
45
-
46
-
47
-
48
-
49
-
50
-
51
-
52
-
53
-
54
-
55
-
56
-
57
-
58
-
59
-
60
-
 61
61 -
 62
62 -
 63
63 -
 64
64 -
 65
65 -
 66
66 -
 67
67 -
 68
68 -
 69
69 -
 70
70 -
 71
71 -
 72
72 -
 73
73 -
 74
74 -
 75
75 -
 76
76 -
 77
77 -
 78
78 -
 79
79 -
 80
80 -
 81
81 -
82
-
83
-
84
-
85
-
86
-
87
-
88
-
89
-
90
-
91
-
92
-
93
-
94
-
95
-
96
-
97
-
98
-
99
-
100
-
101
-
102
-
103
-
104
-
105
-
106
-
107
-
108
-
109
-
110
-
111
-
112
-
113
-
114
-
115
-
116
-
117
-
118
-
119
-
120
-
121
-
122
-
123
-
124
-
125
-
126
-
127
-
128
-
129
-
130
-
131
-
132
-
133
-
134
-
135
-
136
-
137
-
138
-
139
-
140
-
141
-
142
-
143
-
144
-
145
-
146
-
147
-
148
-
149
-
150
-
151
-
152
-
153
-
154
-
155
-
156
-
157
-
158
-
159
-
160
-
161
-
162
-
163
-
164
-
165
-
166
-
167
-
168
-
169
-
170
-
171
-
172
-
173
-
174
-
175
-
176
-
177
-
178
-
179
-
180
-
181
-
182
-
183
-
184
-
185
-
186
-
187
-
188
-
189
-
190
-
191
-
192
-
193
-
194
-
195
-
196
-
197
-
198
-
199
-
200
-
201
-
202
-
203
-
204
-
205
-
206
-
207
-
208
-
209
-
210
-
211
-
212
-
213
-
214
-
215
-
216
-
217
-
218
-
219
-
220
-
221
-
222
-
223
-
224
-
225
-
226
-
227
-
228
-
229
-
230
-
231
-
232
-
233
-
234
-
235
-
236
-
237
-
238
-
239
-
240
-
241
-
242
-
243
-
244
-
245
-
246
-
247
-
248
-
249
-
250
-
251
-
252
-
253
-
254
-
255
-
256
-
257
-
258
-
259
-
260
-
261
-
262
-
263
-
264
-
265
-
266
-
267
-
268
-
269
-
270
-
271
-
272
 |
 |

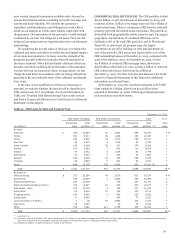
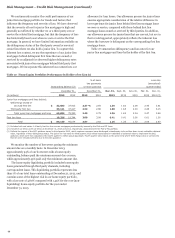
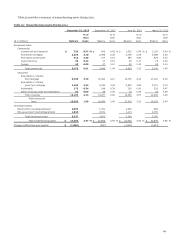
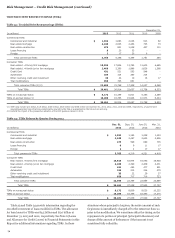
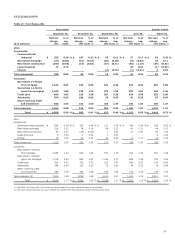
Table 30 provides a summary of nonperforming assets during 2013.
Table 30: Nonperforming Assets During 2013
December 31, 2013 September 30, 2013 June 30, 2013 March 31, 2013
($ in millions) Balance
% of
total
loans Balance
% of
total
loans Balance
% of
total
loans Balance
% of
total
loans
Nonaccrual loans:
Commercial:
Commercial and industrial $ 738 0.37 % $ 809 0.42 % $ 1,022 0.54 % $ 1,193 0.64 %
Real estate mortgage 2,252 2.10 2,496 2.36 2,708 2.59 3,098 2.92
Real estate construction 416 2.48 517 3.15 665 4.04 870 5.23
Lease financing 29 0.24 17 0.15 20 0.17 25 0.20
Foreign 40 0.08 47 0.10 40 0.10 56 0.14
Total commercial 3,475 0.91 3,886 1.04 4,455 1.23 5,242 1.45
Consumer:
Real estate 1-4 family
first mortgage 9,799 3.79 10,450 4.10 10,705 4.23 11,320 4.49
Real estate 1-4 family
junior lien mortgage 2,188 3.32 2,333 3.45 2,522 3.60 2,712 3.74
Automobile 173 0.34 188 0.38 200 0.41 220 0.47
Other revolving credit and installment 33 0.08 36 0.08 33 0.08 32 0.08
Total consumer 12,193 2.74 13,007 2.95 13,460 3.07 14,284 3.26
Total nonaccrual
loans 15,668 1.90 16,893 2.08 17,915 2.23 19,526 2.44
Foreclosed assets:
Government insured/guaranteed 2,093 1,781 1,026 969
Non-government insured/guaranteed 1,844 2,021 2,114 2,381
Total foreclosed assets 3,937 3,802 3,140 3,350
Total nonperforming assets $ 19,605 2.37 % $ 20,695 2.55 % $ 21,055 2.63 % $ 22,876 2.86 %
Change in NPAs from prior quarter $ (1,090) (360) (1,821) (1,633)
69