Wells Fargo 2013 Annual Report Download - page 50
Download and view the complete annual report
Please find page 50 of the 2013 Wells Fargo annual report below. You can navigate through the pages in the report by either clicking on the pages listed below, or by using the keyword search tool below to find specific information within the annual report.-
 1
1 -
2
-
3
-
4
-
5
-
6
-
7
-
8
-
9
-
10
-
11
-
12
-
13
-
14
-
15
-
16
-
17
-
18
-
19
-
20
-
21
-
22
-
23
-
24
-
25
-
26
-
27
-
28
-
29
-
30
-
31
-
32
-
33
-
34
-
35
-
36
-
37
-
38
-
39
-
 40
40 -
 41
41 -
 42
42 -
 43
43 -
 44
44 -
 45
45 -
 46
46 -
 47
47 -
 48
48 -
 49
49 -
 50
50 -
 51
51 -
 52
52 -
 53
53 -
 54
54 -
 55
55 -
 56
56 -
 57
57 -
 58
58 -
 59
59 -
 60
60 -
61
-
62
-
63
-
64
-
65
-
66
-
67
-
68
-
69
-
70
-
71
-
72
-
73
-
74
-
75
-
76
-
77
-
78
-
79
-
80
-
81
-
82
-
83
-
84
-
85
-
86
-
87
-
88
-
89
-
90
-
91
-
92
-
93
-
94
-
95
-
96
-
97
-
98
-
99
-
100
-
101
-
102
-
103
-
104
-
105
-
106
-
107
-
108
-
109
-
110
-
111
-
112
-
113
-
114
-
115
-
116
-
117
-
118
-
119
-
120
-
121
-
122
-
123
-
124
-
125
-
126
-
127
-
128
-
129
-
130
-
131
-
132
-
133
-
134
-
135
-
136
-
137
-
138
-
139
-
140
-
141
-
142
-
143
-
144
-
145
-
146
-
147
-
148
-
149
-
150
-
151
-
152
-
153
-
154
-
155
-
156
-
157
-
158
-
159
-
160
-
161
-
162
-
163
-
164
-
165
-
166
-
167
-
168
-
169
-
170
-
171
-
172
-
173
-
174
-
175
-
176
-
177
-
178
-
179
-
180
-
181
-
182
-
183
-
184
-
185
-
186
-
187
-
188
-
189
-
190
-
191
-
192
-
193
-
194
-
195
-
196
-
197
-
198
-
199
-
200
-
201
-
202
-
203
-
204
-
205
-
206
-
207
-
208
-
209
-
210
-
211
-
212
-
213
-
214
-
215
-
216
-
217
-
218
-
219
-
220
-
221
-
222
-
223
-
224
-
225
-
226
-
227
-
228
-
229
-
230
-
231
-
232
-
233
-
234
-
235
-
236
-
237
-
238
-
239
-
240
-
241
-
242
-
243
-
244
-
245
-
246
-
247
-
248
-
249
-
250
-
251
-
252
-
253
-
254
-
255
-
256
-
257
-
258
-
259
-
260
-
261
-
262
-
263
-
264
-
265
-
266
-
267
-
268
-
269
-
270
-
271
-
272
 |
 |

x
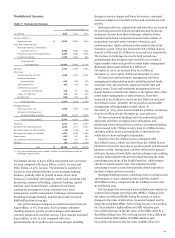
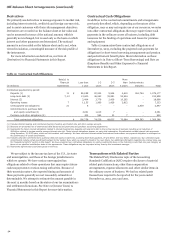
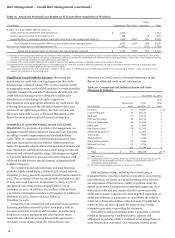
Balance Sheet Analysis (continued)
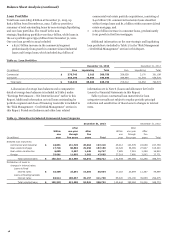
Loan Portfolio
Total loans were $825.8 billion at December 31, 2013, up
$26.2 billion from December 31, 2012. Table 12 provides a
summary of total outstanding loans by non-strategic/liquidating
and core loan portfolios. The runoff in the non-
strategic/liquidating portfolios was $13.7 billion, while loans in
the core portfolio grew $39.9 billion from December 31, 2012.
Our core loan growth in 2013 included:
a $20.7 billion increase in the commercial segment
predominantly from growth in commercial and industrial
loans and foreign loans, which included $5.2 billion of
commercial real estate portfolio acquisitions, consisting of
$4.0 billion U.K. commercial real estate loans classified
within foreign loans and $1.2 billion within commercial real
estate mortgage; and
x a $19.2 billion increase in consumer loans, predominantly
from growth in first lien mortgages.
Additional information on the non-strategic and liquidating
loan portfolios is included in Table 17 in the “Risk Management
– Credit Risk Management” section in this Report.
Table 12: Loan Portfolios
December 31, 2013 December 31, 2012
(in millions) Core Liquidating Total Core Liquidating Total
Commercial $ 378,743 2,013 380,756 358,028 3,170 361,198
Consumer 366,190 78,853 445,043 346,984 91,392 438,376
Total loans $ 744,933 80,866 825,799 705,012 94,562 799,574
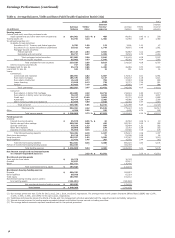
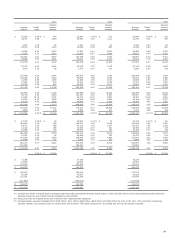
A discussion of average loan balances and a comparative
detail of average loan balances is included in Table 5 under
“Earnings Performance – Net Interest Income” earlier in this
Report. Additional information on total loans outstanding by
portfolio segment and class of financing receivable is included in
the “Risk Management – Credit Risk Management” section in
this Report. Period-end balances and other loan related
information are in Note 6 (Loans and Allowance for Credit
Losses) to Financial Statements in this Report.
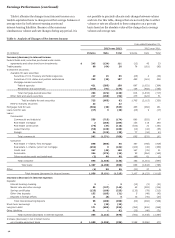
Table 13 shows contractual loan maturities for loan
categories normally not subject to regular periodic principal
reduction and sensitivities of those loans to changes in interest
rates.
Table 13: Maturities for Selected Commercial Loan Categories
December 31, 2013 December 31, 2012
(in millions)
Within
one
year
After
one year
through
five years
After
five
years Total
Within
one
year
After
one year
through
five years
After
five
years Total
Selected loan maturities:
Commercial and industrial $ 44,801 131,745 20,664 197,210 45,212 123,578 18,969 187,759
Real estate mortgage 17,746 60,004 29,350 107,100 22,328 56,085 27,927 106,340
Real estate construction 6,095 9,207 1,445 16,747 7,685 7,961 1,258 16,904
Foreign 33,681 11,602 2,382 47,665 27,219 7,460 3,092 37,771
Total selected loans $ 102,323 212,558 53,841 368,722 102,444 195,084 51,246 348,774
Distribution of loans to
changes in interest rates:
Loans at fixed
interest rates $ 18,409 23,891 14,684 56,984 17,218 20,894 11,387 49,499
Loans at floating/variable
interest rates 83,914 188,667 39,157 311,738 85,226 174,190 39,859 299,275
Total selected loans $ 102,323 212,558 53,841 368,722 102,444 195,084 51,246 348,774
48