Wells Fargo 2013 Annual Report Download - page 33
Download and view the complete annual report
Please find page 33 of the 2013 Wells Fargo annual report below. You can navigate through the pages in the report by either clicking on the pages listed below, or by using the keyword search tool below to find specific information within the annual report.-
 1
1 -
2
-
3
-
4
-
5
-
6
-
7
-
8
-
9
-
10
-
11
-
12
-
13
-
14
-
15
-
16
-
17
-
18
-
19
-
20
-
21
-
22
-
 23
23 -
 24
24 -
 25
25 -
 26
26 -
 27
27 -
 28
28 -
 29
29 -
 30
30 -
 31
31 -
 32
32 -
 33
33 -
 34
34 -
 35
35 -
 36
36 -
 37
37 -
 38
38 -
 39
39 -
 40
40 -
 41
41 -
 42
42 -
 43
43 -
44
-
45
-
46
-
47
-
48
-
49
-
50
-
51
-
52
-
53
-
54
-
55
-
56
-
57
-
58
-
59
-
60
-
61
-
62
-
63
-
64
-
65
-
66
-
67
-
68
-
69
-
70
-
71
-
72
-
73
-
74
-
75
-
76
-
77
-
78
-
79
-
80
-
81
-
82
-
83
-
84
-
85
-
86
-
87
-
88
-
89
-
90
-
91
-
92
-
93
-
94
-
95
-
96
-
97
-
98
-
99
-
100
-
101
-
102
-
103
-
104
-
105
-
106
-
107
-
108
-
109
-
110
-
111
-
112
-
113
-
114
-
115
-
116
-
117
-
118
-
119
-
120
-
121
-
122
-
123
-
124
-
125
-
126
-
127
-
128
-
129
-
130
-
131
-
132
-
133
-
134
-
135
-
136
-
137
-
138
-
139
-
140
-
141
-
142
-
143
-
144
-
145
-
146
-
147
-
148
-
149
-
150
-
151
-
152
-
153
-
154
-
155
-
156
-
157
-
158
-
159
-
160
-
161
-
162
-
163
-
164
-
165
-
166
-
167
-
168
-
169
-
170
-
171
-
172
-
173
-
174
-
175
-
176
-
177
-
178
-
179
-
180
-
181
-
182
-
183
-
184
-
185
-
186
-
187
-
188
-
189
-
190
-
191
-
192
-
193
-
194
-
195
-
196
-
197
-
198
-
199
-
200
-
201
-
202
-
203
-
204
-
205
-
206
-
207
-
208
-
209
-
210
-
211
-
212
-
213
-
214
-
215
-
216
-
217
-
218
-
219
-
220
-
221
-
222
-
223
-
224
-
225
-
226
-
227
-
228
-
229
-
230
-
231
-
232
-
233
-
234
-
235
-
236
-
237
-
238
-
239
-
240
-
241
-
242
-
243
-
244
-
245
-
246
-
247
-
248
-
249
-
250
-
251
-
252
-
253
-
254
-
255
-
256
-
257
-
258
-
259
-
260
-
261
-
262
-
263
-
264
-
265
-
266
-
267
-
268
-
269
-
270
-
271
-
272
 |
 |
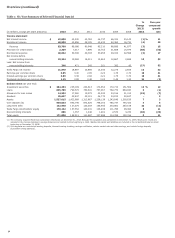
able to grow our loans on a year-over-year basis for 10
consecutive quarters, and for the past seven quarters year-over-
year loan growth has been at least 3%, despite the planned
runoff from our non-strategic/liquidating portfolios. Our non-
strategic/liquidating loan portfolios decreased $13.7 billion
during the year (now less than 10% of total loans) and our core
loan portfolios increased $39.9 billion from the prior year. Our
federal funds sold, securities purchased under resale agreements
and other short-term investments (collectively referred to as
federal funds sold and other short-term investments elsewhere
in this Report) increased by $76.5 billion during the year on
continued strong growth in interest-earning deposits, and we
grew our investment securities portfolio by $29.2 billion in 2013.
While we believe our liquidity position was already strong
with increased regulatory expectations, we have been adding to
our position over the past year. We issued long-term debt and
term-deposits at very low interest rates and most of the proceeds
went into cash and federal funds sold and other short term
investments. Deposit growth remained strong with period-end
deposits up $76.3 billion from 2012. Average deposits have
grown while deposit costs (down 5 basis points from a year ago
to 11 basis points in fourth quarter 2013) have declined for
13 consecutive quarters. We grew our primary consumer
checking customers by a net 4.7% from a year ago
(November 2013 compared with November 2012). The growth in
these relationship-based customers should benefit our future
results as we remain focused on meeting more of our customers’
financial needs.
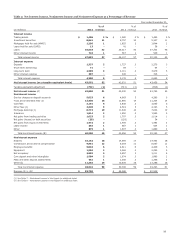
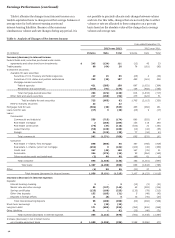
Credit Quality
Credit quality continued to improve in 2013, with solid
performance in several of our commercial and consumer loan
portfolios, reflecting our long-term risk focus and the benefit
from the improving housing market. Net charge-offs of
$4.5 billion were 0.56% of average loans, down 61 basis points
from a year ago. Net losses in our commercial portfolio were
only $206 million, or 6 basis points of average loans. Net
consumer losses declined to 98 basis points in 2013 from
184 basis points in 2012. We continued to have strong
improvement in our commercial and residential real estate
portfolios. Our commercial real estate portfolios were in a net
recovery position for each quarter of 2013 and losses on our
consumer real estate portfolios declined $3.5 billion from a year
ago, down 59%. The consumer loss levels reflected the positive
momentum in the residential real estate market, with home
values improving significantly in many markets, as well as lower
default frequency.
Reflecting these improvements in our loan portfolios, our
provision for credit losses in 2013 was $2.3 billion, which was
$4.9 billion less than a year ago. This provision reflected a
release of $2.2 billion from the allowance for credit losses,
compared with a release of $1.8 billion a year ago. Given current
favorable conditions, we continue to expect future allowance
releases, absent a significant deterioration in the economy.
In addition to lower net charge-offs and provision expense,
nonperforming assets (NPAs) also improved and were down
$4.9 billion, or 20%, from 2012. Nonaccrual loans declined
$4.8 billion from the prior year while foreclosed assets were
down slightly from 2012.
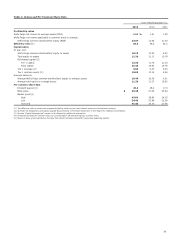
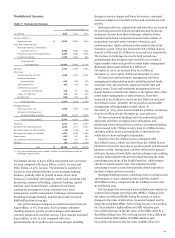
Capital
We continued to strengthen our capital levels in 2013 even as we
returned more capital to our shareholders, increasing total
equity to $171.0 billion at December 31, 2013, up $12.1 billion
from the prior year. Our Tier 1 common equity ratio was 10.82%
of risk-weighted assets (RWA) under Basel I. Our estimated
Common Equity Tier 1 ratio under Basel III, using the advanced
approach method, increased to 9.76% in 2013, exceeding our
internal target of 9%, which includes a 100 basis point internal
capital buffer. The increase in the Basel III ratio was the result of
our strong underlying earnings performance and a reduction in
RWA, which was due to our improved credit profile and model
refinements for our commercial portfolios. We gained more
clarity regarding Basel III capital requirements in 2013 and took
a number of actions to further reduce RWA such as disposing of
an asset that had a punitive risk weighting and obtaining more
granular data related to the underlying investments of life
insurance assets.
For 2013 we paid a total dividend of $1.15 per share, an
increase of 31% from the prior year, and we purchased
124 million shares of common stock in the year. We also
executed a $500 million forward purchase contract that is
expected to settle in first quarter 2014 for approximately
11 million shares.
Our other regulatory capital ratios under Basel I remained
strong with a total risk-based capital ratio of 15.43%, Tier 1 risk-
based capital ratio of 12.33% and Tier 1 leverage ratio of 9.60%
at December 31, 2013, compared with 14.63%, 11.75% and 9.47%,
respectively, at December 31, 2012. In July 2013, U.S. banking
regulatory agencies issued a supplementary leverage ratio
proposal for Basel III. Based on our review, our current leverage
levels would exceed the applicable proposed requirements for
the holding company and each of our insured depository
institutions. See the “Capital Management” section in this
Report for more information regarding our capital, including the
calculation of common equity for regulatory purposes. We
remain committed to returning more capital to our shareholders.
31