Wells Fargo 2013 Annual Report Download - page 218
Download and view the complete annual report
Please find page 218 of the 2013 Wells Fargo annual report below. You can navigate through the pages in the report by either clicking on the pages listed below, or by using the keyword search tool below to find specific information within the annual report.-
 1
1 -
2
-
3
-
4
-
5
-
6
-
7
-
8
-
9
-
10
-
11
-
12
-
13
-
14
-
15
-
16
-
17
-
18
-
19
-
20
-
21
-
22
-
23
-
24
-
25
-
26
-
27
-
28
-
29
-
30
-
31
-
32
-
33
-
34
-
35
-
36
-
37
-
38
-
39
-
40
-
41
-
42
-
43
-
44
-
45
-
46
-
47
-
48
-
49
-
50
-
51
-
52
-
53
-
54
-
55
-
56
-
57
-
58
-
59
-
60
-
61
-
62
-
63
-
64
-
65
-
66
-
67
-
68
-
69
-
70
-
71
-
72
-
73
-
74
-
75
-
76
-
77
-
78
-
79
-
80
-
81
-
82
-
83
-
84
-
85
-
86
-
87
-
88
-
89
-
90
-
91
-
92
-
93
-
94
-
95
-
96
-
97
-
98
-
99
-
100
-
101
-
102
-
103
-
104
-
105
-
106
-
107
-
108
-
109
-
110
-
111
-
112
-
113
-
114
-
115
-
116
-
117
-
118
-
119
-
120
-
121
-
122
-
123
-
124
-
125
-
126
-
127
-
128
-
129
-
130
-
131
-
132
-
133
-
134
-
135
-
136
-
137
-
138
-
139
-
140
-
141
-
142
-
143
-
144
-
145
-
146
-
147
-
148
-
149
-
150
-
151
-
152
-
153
-
154
-
155
-
156
-
157
-
158
-
159
-
160
-
161
-
162
-
163
-
164
-
165
-
166
-
167
-
168
-
169
-
170
-
171
-
172
-
173
-
174
-
175
-
176
-
177
-
178
-
179
-
180
-
181
-
182
-
183
-
184
-
185
-
186
-
187
-
188
-
189
-
190
-
191
-
192
-
193
-
194
-
195
-
196
-
197
-
198
-
199
-
200
-
201
-
202
-
203
-
204
-
205
-
206
-
207
-
 208
208 -
 209
209 -
 210
210 -
 211
211 -
 212
212 -
 213
213 -
 214
214 -
 215
215 -
 216
216 -
 217
217 -
 218
218 -
 219
219 -
 220
220 -
 221
221 -
 222
222 -
 223
223 -
 224
224 -
 225
225 -
 226
226 -
 227
227 -
 228
228 -
229
-
230
-
231
-
232
-
233
-
234
-
235
-
236
-
237
-
238
-
239
-
240
-
241
-
242
-
243
-
244
-
245
-
246
-
247
-
248
-
249
-
250
-
251
-
252
-
253
-
254
-
255
-
256
-
257
-
258
-
259
-
260
-
261
-
262
-
263
-
264
-
265
-
266
-
267
-
268
-
269
-
270
-
271
-
272
 |
 |
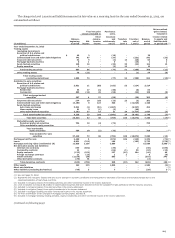
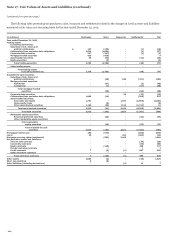
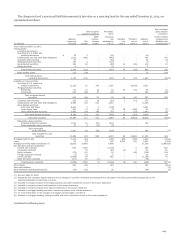
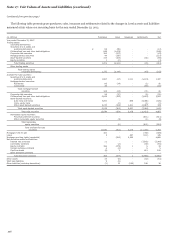
Note 17: Fair Values of Assets and Liabilities (continued)
techniques, such as weighting of internal models and vendor or
broker pricing, where the unobservable inputs are significant to
the overall fair value measurement. Securities classified as Level
3 include certain residential and commercial MBS, other asset-
backed securities, CDOs and certain CLOs, and certain residual
and retained interests in residential mortgage loan
securitizations. We value CDOs using the prices of similar
instruments, the pricing of completed or pending third party
transactions or the pricing of the underlying collateral within the
CDO. Where vendor or broker prices are not readily available,
we use management's best estimate.
MORTGAGES HELD FOR SALE (MHFS) We carry substantially
all of our residential MHFS portfolio at fair value. Fair value is
based on quoted market prices, where available, or the prices for
other mortgage whole loans with similar characteristics. As
necessary, these prices are adjusted for typical securitization
activities, including servicing value, portfolio composition,
market conditions and liquidity. Most of our MHFS are classified
as Level 2. For the portion where market pricing data is not
available, we use a discounted cash flow model to estimate fair
value and, accordingly, classify as Level 3.
LOANS HELD FOR SALE (LHFS) LHFS are carried at the lower
of cost or market value, or at fair value. The fair value of LHFS is
based on what secondary markets are currently offering for loans
with similar characteristics. As such, we classify those loans
subjected to nonrecurring fair value adjustments as Level 2.
LOANS For information on how we report the carrying value of
loans, including PCI loans, see Note 1. Although most loans are
not recorded at fair value on a recurring basis, reverse mortgages
are recorded at fair value on a recurring basis. In addition, we
record nonrecurring fair value adjustments to loans to reflect
partial write-downs that are based on the observable market
price of the loan or current appraised value of the collateral.
We provide fair value estimates in this disclosure for loans
that are not recorded at fair value on a recurring or nonrecurring
basis. Those estimates differentiate loans based on their
financial characteristics, such as product classification, loan
category, pricing features and remaining maturity. Prepayment
and credit loss estimates are evaluated by product and loan rate.
The fair value of commercial loans is calculated by
discounting contractual cash flows, adjusted for credit loss
estimates, using discount rates that are appropriate for loans
with similar characteristics and remaining maturity.
For real estate 1-4 family first and junior lien mortgages, we
calculate fair value by discounting contractual cash flows,
adjusted for prepayment and credit loss estimates, using
discount rates based on current industry pricing (where readily
available) or our own estimate of an appropriate discount rate
for loans of similar size, type, remaining maturity and repricing
characteristics.
The carrying value of credit card loans, which is adjusted for
estimates of credit losses inherent in the portfolio at the balance
sheet date, is reported as a reasonable estimate of fair value. For
all other consumer loans, the fair value is generally calculated by
discounting the contractual cash flows, adjusted for prepayment
and credit loss estimates, based on the current rates we offer for
loans with similar characteristics.
Loan commitments, standby letters of credit and commercial
and similar letters of credit generate ongoing fees at our current
pricing levels, which are recognized over the term of the
commitment period. In situations where the credit quality of the
counterparty to a commitment has declined, we record an
allowance. A reasonable estimate of the fair value of these
instruments is the carrying value of deferred fees plus the related
allowance. Certain letters of credit that are hedged with
derivative instruments are carried at fair value in trading assets
or liabilities. For those letters of credit, fair value is calculated
based on readily quotable credit default spreads using a market
risk credit default swap model.
DERIVATIVES Quoted market prices are available and used for
our exchange-traded derivatives, such as certain interest rate
futures and option contracts, which we classify as Level 1.
However, substantially all of our derivatives are traded in over-
the-counter (OTC) markets where quoted market prices are not
always readily available. Therefore we value most OTC
derivatives using internal valuation techniques. Valuation
techniques and inputs to internally-developed models depend on
the type of derivative and nature of the underlying rate, price or
index upon which the derivative's value is based. Key inputs can
include yield curves, credit curves, foreign-exchange rates,
prepayment rates, volatility measurements and correlation of
such inputs. Where model inputs can be observed in a liquid
market and the model does not require significant judgment,
such derivatives are typically classified as Level 2 of the fair
value hierarchy. Examples of derivatives classified as Level 2
include generic interest rate swaps, foreign currency swaps,
commodity swaps, and certain option and forward contracts.
When instruments are traded in less liquid markets and
significant inputs are unobservable, such derivatives are
classified as Level 3. Examples of derivatives classified as Level 3
include complex and highly structured derivatives, certain credit
default swaps, interest rate lock commitments written for our
residential mortgage loans that we intend to sell and long dated
equity options where volatility is not observable. Additionally,
significant judgments are required when classifying financial
instruments within the fair value hierarchy, particularly between
Level 2 and 3, as is the case for certain derivatives.
MORTGAGE SERVICING RIGHTS (MSRs) AND CERTAIN
OTHER INTERESTS HELD IN SECURITIZATIONS MSRs and
certain other interests held in securitizations (e.g., interest-only
strips) do not trade in an active market with readily observable
prices. Accordingly, we determine the fair value of MSRs using a
valuation model that calculates the present value of estimated
future net servicing income cash flows. The model incorporates
assumptions that market participants use in estimating future
net servicing income cash flows, including estimates of
prepayment speeds (including housing price volatility), discount
rates, default rates, cost to service (including delinquency and
foreclosure costs), escrow account earnings, contractual
servicing fee income, ancillary income and late fees. Commercial
MSRs are carried at lower of cost or market value, and therefore
216