Wells Fargo 2013 Annual Report Download - page 164
Download and view the complete annual report
Please find page 164 of the 2013 Wells Fargo annual report below. You can navigate through the pages in the report by either clicking on the pages listed below, or by using the keyword search tool below to find specific information within the annual report.-
 1
1 -
2
-
3
-
4
-
5
-
6
-
7
-
8
-
9
-
10
-
11
-
12
-
13
-
14
-
15
-
16
-
17
-
18
-
19
-
20
-
21
-
22
-
23
-
24
-
25
-
26
-
27
-
28
-
29
-
30
-
31
-
32
-
33
-
34
-
35
-
36
-
37
-
38
-
39
-
40
-
41
-
42
-
43
-
44
-
45
-
46
-
47
-
48
-
49
-
50
-
51
-
52
-
53
-
54
-
55
-
56
-
57
-
58
-
59
-
60
-
61
-
62
-
63
-
64
-
65
-
66
-
67
-
68
-
69
-
70
-
71
-
72
-
73
-
74
-
75
-
76
-
77
-
78
-
79
-
80
-
81
-
82
-
83
-
84
-
85
-
86
-
87
-
88
-
89
-
90
-
91
-
92
-
93
-
94
-
95
-
96
-
97
-
98
-
99
-
100
-
101
-
102
-
103
-
104
-
105
-
106
-
107
-
108
-
109
-
110
-
111
-
112
-
113
-
114
-
115
-
116
-
117
-
118
-
119
-
120
-
121
-
122
-
123
-
124
-
125
-
126
-
127
-
128
-
129
-
130
-
131
-
132
-
133
-
134
-
135
-
136
-
137
-
138
-
139
-
140
-
141
-
142
-
143
-
144
-
145
-
146
-
147
-
148
-
149
-
150
-
151
-
152
-
153
-
 154
154 -
 155
155 -
 156
156 -
 157
157 -
 158
158 -
 159
159 -
 160
160 -
 161
161 -
 162
162 -
 163
163 -
 164
164 -
 165
165 -
 166
166 -
 167
167 -
 168
168 -
 169
169 -
 170
170 -
 171
171 -
 172
172 -
 173
173 -
 174
174 -
175
-
176
-
177
-
178
-
179
-
180
-
181
-
182
-
183
-
184
-
185
-
186
-
187
-
188
-
189
-
190
-
191
-
192
-
193
-
194
-
195
-
196
-
197
-
198
-
199
-
200
-
201
-
202
-
203
-
204
-
205
-
206
-
207
-
208
-
209
-
210
-
211
-
212
-
213
-
214
-
215
-
216
-
217
-
218
-
219
-
220
-
221
-
222
-
223
-
224
-
225
-
226
-
227
-
228
-
229
-
230
-
231
-
232
-
233
-
234
-
235
-
236
-
237
-
238
-
239
-
240
-
241
-
242
-
243
-
244
-
245
-
246
-
247
-
248
-
249
-
250
-
251
-
252
-
253
-
254
-
255
-
256
-
257
-
258
-
259
-
260
-
261
-
262
-
263
-
264
-
265
-
266
-
267
-
268
-
269
-
270
-
271
-
272
 |
 |

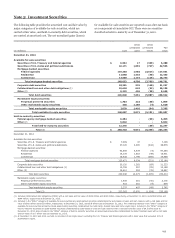
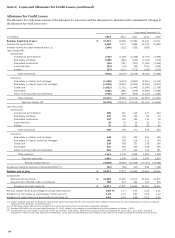
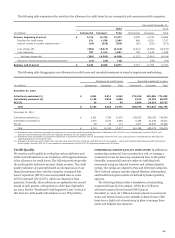
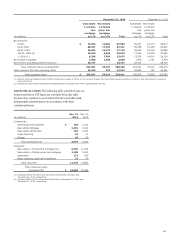
Note 5: Investment Securities (continued)
To determine credit impairment losses for asset-backed
securities (e.g., residential MBS, commercial MBS), we estimate
expected future cash flows of the security by estimating the
expected future cash flows of the underlying collateral and
applying those collateral cash flows, together with any credit
enhancements such as subordinated interests owned by third
parties, to the security. The expected future cash flows of the
underlying collateral are determined using the remaining
contractual cash flows adjusted for future expected credit losses
(which consider current delinquencies and nonperforming assets
(NPAs), future expected default rates and collateral value by
vintage and geographic region) and prepayments. The expected
cash flows of the security are then discounted at the security’s
current effective interest rate to arrive at a present value
amount. Total credit impairment losses on residential MBS that
we do not intend to sell are shown in the table below. The table
also presents a summary of the significant inputs considered in
determining the measurement of the credit loss component
recognized in earnings for residential MBS.
Year ended December 31,
($ in millions) 2013 2012 2011
Credit impairment losses on residential MBS
Investment grade $ - -5
Non-investment grade 72 84 247
Total credit impairment losses on residential MBS $ 72 84 252
Significant inputs (non-agency – non-investment grade MBS)
Expected remaining life of loan loss rate (1):
Range (2) 0-20 % 1-44 0-48
Credit impairment loss rate distribution (3):
0 - 10% range 91 77 42
10 - 20% range 8 11 18
20 - 30% range 1 4 28
Greater than 30% - 8 12
Weighted average loss rate (4) 6 8 12
Current subordination levels (5):
Range (2) 0-41 0-57 0-25
Weighted average (4) -2 4
Prepayment speed (annual CPR (6)):
Range (2) 4-27 5-29 3-19
Weighted average (4) 16 15 11
(1) Represents future expected credit losses on each pool of loans underlying respective securities expressed as a percentage of the total current outstanding loan balance of the
pool for each respective security.
(2) Represents the range of inputs/assumptions based upon the individual securities within each category.
(3) Represents distribution of credit impairment losses recognized in earnings categorized based on range of expected remaining life of loan losses. For example 91% of credit
impairment losses recognized in earnings for the year ended December 31, 2013, had expected remaining life of loan loss assumptions of 0 to 10%.
(4) Calculated by weighting the relevant input/assumption for each individual security by current outstanding amortized cost basis of the security.
(5) Represents current level of credit protection provided by tranches subordinate to our security holdings (subordination), expressed as a percentage of total current underlying
loan balance.
(6) Constant prepayment rate.
Total credit impairment losses on commercial MBS that we
do not intend to sell were $28 million, $86 million, and
$101 million for the years ended December 31, 2013, 2012 and
2011, respectively. Significant inputs considered in determining
the credit impairment losses for commercial MBS are the
expected remaining life of loan loss rates and current
subordination levels. Prepayment activity on commercial MBS
does not significantly impact the determination of their credit
impairment because, unlike residential MBS, commercial MBS
experience significantly lower prepayments due to certain
contractual restrictions, impacting the borrower’s ability to
prepay the mortgage. The expected remaining life of loan loss
rates for commercial MBS with credit impairment losses ranged
from 4% to 15%, 3% to 18%, and 4% to 18%, while the current
subordination level ranges were 0% to 21%, 0% to 13%, and 3%
to 15% for the years ended December 31, 2013, 2012 and 2011,
respectively.
162