Wells Fargo 2013 Annual Report Download - page 243
Download and view the complete annual report
Please find page 243 of the 2013 Wells Fargo annual report below. You can navigate through the pages in the report by either clicking on the pages listed below, or by using the keyword search tool below to find specific information within the annual report.-
 1
1 -
2
-
3
-
4
-
5
-
6
-
7
-
8
-
9
-
10
-
11
-
12
-
13
-
14
-
15
-
16
-
17
-
18
-
19
-
20
-
21
-
22
-
23
-
24
-
25
-
26
-
27
-
28
-
29
-
30
-
31
-
32
-
33
-
34
-
35
-
36
-
37
-
38
-
39
-
40
-
41
-
42
-
43
-
44
-
45
-
46
-
47
-
48
-
49
-
50
-
51
-
52
-
53
-
54
-
55
-
56
-
57
-
58
-
59
-
60
-
61
-
62
-
63
-
64
-
65
-
66
-
67
-
68
-
69
-
70
-
71
-
72
-
73
-
74
-
75
-
76
-
77
-
78
-
79
-
80
-
81
-
82
-
83
-
84
-
85
-
86
-
87
-
88
-
89
-
90
-
91
-
92
-
93
-
94
-
95
-
96
-
97
-
98
-
99
-
100
-
101
-
102
-
103
-
104
-
105
-
106
-
107
-
108
-
109
-
110
-
111
-
112
-
113
-
114
-
115
-
116
-
117
-
118
-
119
-
120
-
121
-
122
-
123
-
124
-
125
-
126
-
127
-
128
-
129
-
130
-
131
-
132
-
133
-
134
-
135
-
136
-
137
-
138
-
139
-
140
-
141
-
142
-
143
-
144
-
145
-
146
-
147
-
148
-
149
-
150
-
151
-
152
-
153
-
154
-
155
-
156
-
157
-
158
-
159
-
160
-
161
-
162
-
163
-
164
-
165
-
166
-
167
-
168
-
169
-
170
-
171
-
172
-
173
-
174
-
175
-
176
-
177
-
178
-
179
-
180
-
181
-
182
-
183
-
184
-
185
-
186
-
187
-
188
-
189
-
190
-
191
-
192
-
193
-
194
-
195
-
196
-
197
-
198
-
199
-
200
-
201
-
202
-
203
-
204
-
205
-
206
-
207
-
208
-
209
-
210
-
211
-
212
-
213
-
214
-
215
-
216
-
217
-
218
-
219
-
220
-
221
-
222
-
223
-
224
-
225
-
226
-
227
-
228
-
229
-
230
-
231
-
232
-
 233
233 -
 234
234 -
 235
235 -
 236
236 -
 237
237 -
 238
238 -
 239
239 -
 240
240 -
 241
241 -
 242
242 -
 243
243 -
 244
244 -
 245
245 -
 246
246 -
 247
247 -
 248
248 -
 249
249 -
 250
250 -
 251
251 -
 252
252 -
 253
253 -
254
-
255
-
256
-
257
-
258
-
259
-
260
-
261
-
262
-
263
-
264
-
265
-
266
-
267
-
268
-
269
-
270
-
271
-
272
 |
 |

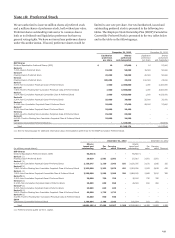
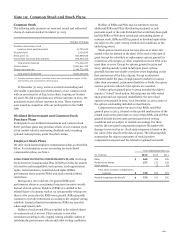
Note 19: Common Stock and Stock Plans
Common Stock
The following table presents our reserved, issued and authorized
shares of common stock at December 31, 2013.
Number of shares
Dividend reinvestment and
common stock purchase plans 11,732,445
Director plans 1,054,645
Stock plans (1) 653,684,625
Convertible securities and warrants 104,944,332
Total shares reserved 771,416,047
Shares issued 5,481,811,474
Shares not reserved 2,746,772,479
Total shares authorized 9,000,000,000
(1) Includes employee options, restricted shares and restricted share rights, 401(k),
profit sharing and compensation deferral plans.
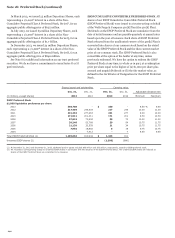
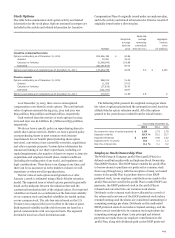
At December 31, 2013, we have warrants outstanding and
exercisable to purchase 39,108,864 shares of our common stock
with an exercise price of $34.01 per share, expiring on October
28, 2018. We did not purchase any of these warrants in 2013. We
purchased 70,210 of these warrants in 2012. These warrants
were issued in connection with our participation in the TARP
CPP.
Dividend Reinvestment and Common Stock
Purchase Plans
Participants in our dividend reinvestment and common stock
direct purchase plans may purchase shares of our common stock
at fair market value by reinvesting dividends and/or making
optional cash payments, under the plan's terms.
Employee Stock Plans
We offer stock-based employee compensation plans as described
below. For information on our accounting for stock-based
compensation plans, see Note 1.
LONG-TERM INCENTIVE COMPENSATION PLANS Our Long-
Term Incentive Compensation Plan (LTICP) provides for awards
of incentive and nonqualified stock options, stock appreciation
rights, restricted shares, restricted stock rights (RSRs),
performance share awards (PSAs) and stock awards without
restrictions.
During 2013, 2012 and 2011 we granted RSRs and
performance shares as our primary long-term incentive awards
instead of stock options. Holders of RSRs are entitled to the
related shares of common stock at no cost generally vesting over
three to five years after the RSRs were granted. RSRs generally
continue to vest after retirement according to the original vesting
schedule. Except in limited circumstances, RSRs are canceled
when employment ends.
Holders of each vested PSA are entitled to the related shares
of common stock at no cost. PSAs continue to vest after
retirement according to the original vesting schedule subject to
satisfying the performance criteria and other vesting conditions.
Holders of RSRs and PSAs may be entitled to receive
additional RSRs and PSAs (dividend equivalents) or cash
payments equal to the cash dividends that would have been paid
had the RSRs or PSAs been issued and outstanding shares of
common stock. RSRs and PSAs granted as dividend equivalents
are subject to the same vesting schedule and conditions as the
underlying award.
Stock options must have an exercise price at or above fair
market value (as defined in the plan) of the stock at the date of
grant (except for substitute or replacement options granted in
connection with mergers or other acquisitions) and a term of no
more than 10 years. Except for options granted in 2004 and
2005, which generally vested in full upon grant, options
generally become exercisable over three years beginning on the
first anniversary of the date of grant. Except as otherwise
permitted under the plan, if employment is ended for reasons
other than retirement, permanent disability or death, the option
exercise period is reduced or the options are canceled.
Certain options granted prior to 2004 included the right to
acquire a “reload” stock option. Reload grants are fully vested
upon grant and are expensed immediately; the last reload
options were granted in 2013. As of December 31, 2013, none of
the options outstanding included a reload feature.
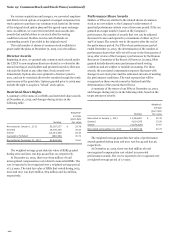
Compensation expense for most of our RSRs, and PSAs
granted prior to 2013, is based on the quoted market price of the
related stock at the grant date; in 2013 certain RSRs and all PSAs
granted include discretionary performance based vesting
conditions and are subject to variable accounting. For these
awards, the associated compensation expense fluctuates with
changes in our stock price. Stock option expense is based on the
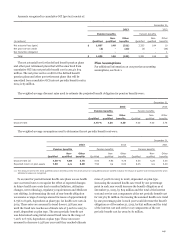
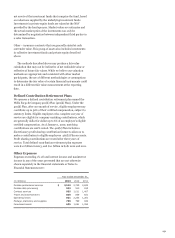
fair value of the awards at the date of grant. The following table
summarizes the major components of stock incentive
compensation expense and the related recognized tax benefit.
Year ended December 31,
(in millions) 2013 2012 2011
RSRs $ 568 435 338
Performance shares 157 112 128
Stock options - 13 63
Total stock incentive compensation
expense $ 725 560 529
Related recognized tax benefit $ 273 211 200
241