Wells Fargo 2013 Annual Report Download - page 256
Download and view the complete annual report
Please find page 256 of the 2013 Wells Fargo annual report below. You can navigate through the pages in the report by either clicking on the pages listed below, or by using the keyword search tool below to find specific information within the annual report.-
 1
1 -
2
-
3
-
4
-
5
-
6
-
7
-
8
-
9
-
10
-
11
-
12
-
13
-
14
-
15
-
16
-
17
-
18
-
19
-
20
-
21
-
22
-
23
-
24
-
25
-
26
-
27
-
28
-
29
-
30
-
31
-
32
-
33
-
34
-
35
-
36
-
37
-
38
-
39
-
40
-
41
-
42
-
43
-
44
-
45
-
46
-
47
-
48
-
49
-
50
-
51
-
52
-
53
-
54
-
55
-
56
-
57
-
58
-
59
-
60
-
61
-
62
-
63
-
64
-
65
-
66
-
67
-
68
-
69
-
70
-
71
-
72
-
73
-
74
-
75
-
76
-
77
-
78
-
79
-
80
-
81
-
82
-
83
-
84
-
85
-
86
-
87
-
88
-
89
-
90
-
91
-
92
-
93
-
94
-
95
-
96
-
97
-
98
-
99
-
100
-
101
-
102
-
103
-
104
-
105
-
106
-
107
-
108
-
109
-
110
-
111
-
112
-
113
-
114
-
115
-
116
-
117
-
118
-
119
-
120
-
121
-
122
-
123
-
124
-
125
-
126
-
127
-
128
-
129
-
130
-
131
-
132
-
133
-
134
-
135
-
136
-
137
-
138
-
139
-
140
-
141
-
142
-
143
-
144
-
145
-
146
-
147
-
148
-
149
-
150
-
151
-
152
-
153
-
154
-
155
-
156
-
157
-
158
-
159
-
160
-
161
-
162
-
163
-
164
-
165
-
166
-
167
-
168
-
169
-
170
-
171
-
172
-
173
-
174
-
175
-
176
-
177
-
178
-
179
-
180
-
181
-
182
-
183
-
184
-
185
-
186
-
187
-
188
-
189
-
190
-
191
-
192
-
193
-
194
-
195
-
196
-
197
-
198
-
199
-
200
-
201
-
202
-
203
-
204
-
205
-
206
-
207
-
208
-
209
-
210
-
211
-
212
-
213
-
214
-
215
-
216
-
217
-
218
-
219
-
220
-
221
-
222
-
223
-
224
-
225
-
226
-
227
-
228
-
229
-
230
-
231
-
232
-
233
-
234
-
235
-
236
-
237
-
238
-
239
-
240
-
241
-
242
-
243
-
244
-
245
-
 246
246 -
 247
247 -
 248
248 -
 249
249 -
 250
250 -
 251
251 -
 252
252 -
 253
253 -
 254
254 -
 255
255 -
 256
256 -
 257
257 -
 258
258 -
 259
259 -
 260
260 -
 261
261 -
 262
262 -
 263
263 -
 264
264 -
 265
265 -
 266
266 -
267
-
268
-
269
-
270
-
271
-
272
 |
 |

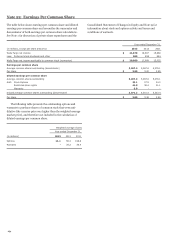
Note 22: Earnings Per Common Share
The table below shows earnings per common share and diluted
earnings per common share and reconciles the numerator and
denominator of both earnings per common share calculations.
See Note 1 for discussion of private share repurchases and the
Consolidated Statement of Changes in Equity and Note 19 for
information about stock and options activity and terms and
conditions of warrants.
Year ended December 31,
(in millions, except per share amounts) 2013 2012 2011
Wells Fargo net income $ 21,878 18,897 15,869
Less: Preferred stock dividends and other 989 898 844
Wells Fargo net income applicable to common stock (numerator) $ 20,889 17,999 15,025
Earnings per common share
Average common shares outstanding (denominator) 5,287.3 5,287.6 5,278.1
Per share $ 3.95 3.40 2.85
Diluted earnings per common share
Average common shares outstanding 5,287.3 5,287.6 5,278.1
Add: Stock Options 33.1 27.5 24.2
Restricted share rights 44.8 36.4 21.1
Warrants 6.0 - -
Diluted average common shares outstanding (denominator) 5,371.2 5,351.5 5,323.4
Per share $ 3.89 3.36 2.82
The following table presents the outstanding options and
warrants to purchase shares of common stock that were anti-
dilutive (the exercise price was higher than the weighted-average
market price), and therefore not included in the calculation of
diluted earnings per common share.
Weighted-average shares
Year ended December 31,
(in millions) 2013 2012 2011
Options 11.1 56.4 198.8
Warrants - 39.2 39.4
254